Ecuadorian vs Jamaican In Labor Force | Age 25-29
COMPARE
Ecuadorian
Jamaican
In Labor Force | Age 25-29
In Labor Force | Age 25-29 Comparison
Ecuadorians
Jamaicans
84.4%
IN LABOR FORCE | AGE 25-29
14.8/ 100
METRIC RATING
205th/ 347
METRIC RANK
83.9%
IN LABOR FORCE | AGE 25-29
0.8/ 100
METRIC RATING
239th/ 347
METRIC RANK
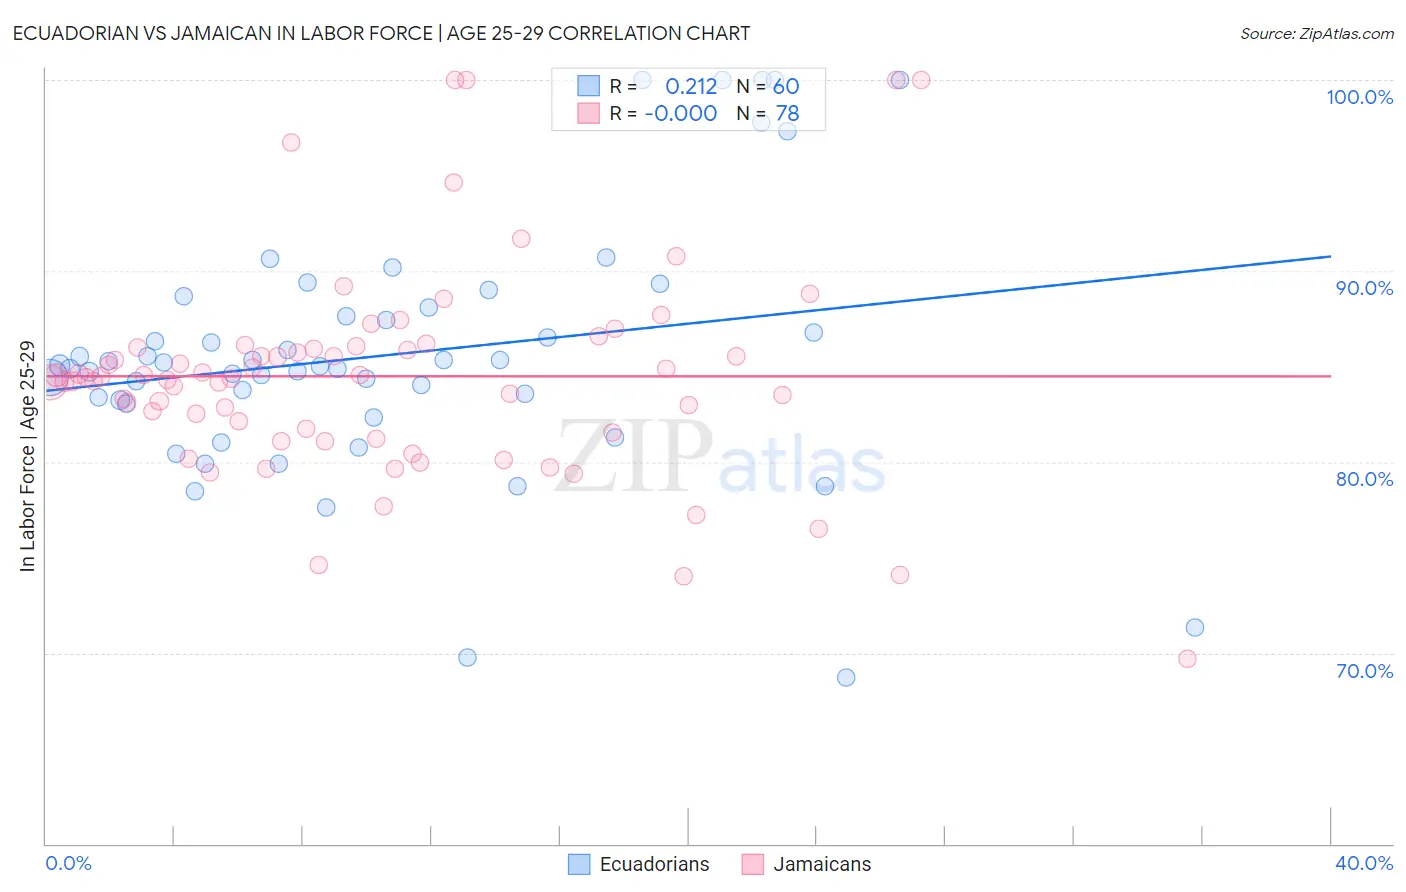
Ecuadorian vs Jamaican In Labor Force | Age 25-29 Correlation Chart
The statistical analysis conducted on geographies consisting of 317,761,699 people shows a weak positive correlation between the proportion of Ecuadorians and labor force participation rate among population between the ages 25 and 29 in the United States with a correlation coefficient (R) of 0.212 and weighted average of 84.4%. Similarly, the statistical analysis conducted on geographies consisting of 367,887,997 people shows no correlation between the proportion of Jamaicans and labor force participation rate among population between the ages 25 and 29 in the United States with a correlation coefficient (R) of -0.000 and weighted average of 83.9%, a difference of 0.58%.
In Labor Force | Age 25-29 Correlation Summary
| Measurement | Ecuadorian | Jamaican |
| Minimum | 68.7% | 69.7% |
| Maximum | 100.0% | 100.0% |
| Range | 31.3% | 30.3% |
| Mean | 85.6% | 84.5% |
| Median | 85.0% | 84.4% |
| Interquartile 25% (IQ1) | 83.1% | 81.6% |
| Interquartile 75% (IQ3) | 87.8% | 86.0% |
| Interquartile Range (IQR) | 4.7% | 4.4% |
| Standard Deviation (Sample) | 6.7% | 5.6% |
| Standard Deviation (Population) | 6.6% | 5.5% |
Similar Demographics by In Labor Force | Age 25-29
Demographics Similar to Ecuadorians by In Labor Force | Age 25-29
In terms of in labor force | age 25-29, the demographic groups most similar to Ecuadorians are Venezuelan (84.4%, a difference of 0.0%), Immigrants from Afghanistan (84.4%, a difference of 0.010%), Immigrants from Cambodia (84.4%, a difference of 0.010%), Laotian (84.4%, a difference of 0.020%), and Afghan (84.4%, a difference of 0.020%).
| Demographics | Rating | Rank | In Labor Force | Age 25-29 |
| Immigrants | Iraq | 19.0 /100 | #198 | Poor 84.4% |
| Immigrants | Germany | 18.3 /100 | #199 | Poor 84.4% |
| Immigrants | Kazakhstan | 17.5 /100 | #200 | Poor 84.4% |
| Laotians | 16.6 /100 | #201 | Poor 84.4% |
| Afghans | 15.9 /100 | #202 | Poor 84.4% |
| Immigrants | Afghanistan | 15.6 /100 | #203 | Poor 84.4% |
| Venezuelans | 15.1 /100 | #204 | Poor 84.4% |
| Ecuadorians | 14.8 /100 | #205 | Poor 84.4% |
| Immigrants | Cambodia | 14.3 /100 | #206 | Poor 84.4% |
| Immigrants | Armenia | 13.3 /100 | #207 | Poor 84.4% |
| Immigrants | Indonesia | 13.2 /100 | #208 | Poor 84.4% |
| Immigrants | Jordan | 12.8 /100 | #209 | Poor 84.4% |
| Chinese | 12.7 /100 | #210 | Poor 84.3% |
| Immigrants | Venezuela | 12.6 /100 | #211 | Poor 84.3% |
| Sub-Saharan Africans | 11.7 /100 | #212 | Poor 84.3% |
Demographics Similar to Jamaicans by In Labor Force | Age 25-29
In terms of in labor force | age 25-29, the demographic groups most similar to Jamaicans are Immigrants from Uzbekistan (83.9%, a difference of 0.0%), Trinidadian and Tobagonian (83.9%, a difference of 0.0%), Immigrants (83.9%, a difference of 0.030%), Alsatian (83.9%, a difference of 0.030%), and Iraqi (83.9%, a difference of 0.040%).
| Demographics | Rating | Rank | In Labor Force | Age 25-29 |
| Panamanians | 4.5 /100 | #232 | Tragic 84.2% |
| Immigrants | Western Asia | 2.7 /100 | #233 | Tragic 84.1% |
| Barbadians | 1.0 /100 | #234 | Tragic 83.9% |
| Iraqis | 0.9 /100 | #235 | Tragic 83.9% |
| Guamanians/Chamorros | 0.9 /100 | #236 | Tragic 83.9% |
| Immigrants | Immigrants | 0.9 /100 | #237 | Tragic 83.9% |
| Immigrants | Uzbekistan | 0.8 /100 | #238 | Tragic 83.9% |
| Jamaicans | 0.8 /100 | #239 | Tragic 83.9% |
| Trinidadians and Tobagonians | 0.7 /100 | #240 | Tragic 83.9% |
| Alsatians | 0.7 /100 | #241 | Tragic 83.9% |
| U.S. Virgin Islanders | 0.6 /100 | #242 | Tragic 83.8% |
| Salvadorans | 0.5 /100 | #243 | Tragic 83.8% |
| Immigrants | Jamaica | 0.4 /100 | #244 | Tragic 83.8% |
| Iroquois | 0.4 /100 | #245 | Tragic 83.8% |
| Cree | 0.3 /100 | #246 | Tragic 83.8% |