Japanese vs Jamaican In Labor Force | Age 25-29
COMPARE
Japanese
Jamaican
In Labor Force | Age 25-29
In Labor Force | Age 25-29 Comparison
Japanese
Jamaicans
84.3%
IN LABOR FORCE | AGE 25-29
11.4/ 100
METRIC RATING
213th/ 347
METRIC RANK
83.9%
IN LABOR FORCE | AGE 25-29
0.8/ 100
METRIC RATING
239th/ 347
METRIC RANK
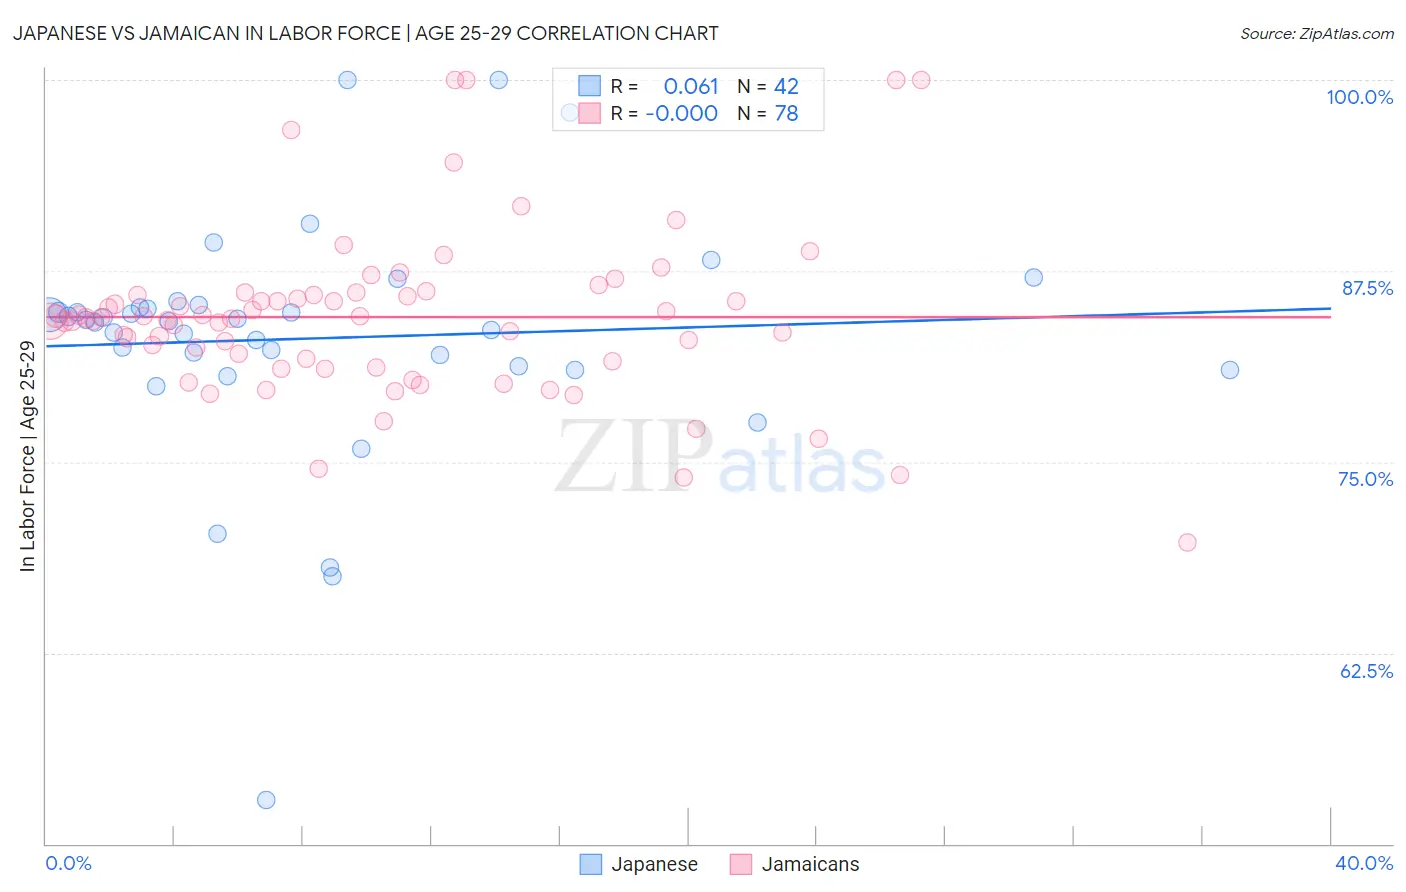
Japanese vs Jamaican In Labor Force | Age 25-29 Correlation Chart
The statistical analysis conducted on geographies consisting of 249,141,498 people shows a slight positive correlation between the proportion of Japanese and labor force participation rate among population between the ages 25 and 29 in the United States with a correlation coefficient (R) of 0.061 and weighted average of 84.3%. Similarly, the statistical analysis conducted on geographies consisting of 367,887,997 people shows no correlation between the proportion of Jamaicans and labor force participation rate among population between the ages 25 and 29 in the United States with a correlation coefficient (R) of -0.000 and weighted average of 83.9%, a difference of 0.52%.
In Labor Force | Age 25-29 Correlation Summary
| Measurement | Japanese | Jamaican |
| Minimum | 52.9% | 69.7% |
| Maximum | 100.0% | 100.0% |
| Range | 47.1% | 30.3% |
| Mean | 83.1% | 84.5% |
| Median | 84.3% | 84.4% |
| Interquartile 25% (IQ1) | 81.3% | 81.6% |
| Interquartile 75% (IQ3) | 85.1% | 86.0% |
| Interquartile Range (IQR) | 3.8% | 4.4% |
| Standard Deviation (Sample) | 8.0% | 5.6% |
| Standard Deviation (Population) | 7.9% | 5.5% |
Similar Demographics by In Labor Force | Age 25-29
Demographics Similar to Japanese by In Labor Force | Age 25-29
In terms of in labor force | age 25-29, the demographic groups most similar to Japanese are Subsaharan African (84.3%, a difference of 0.0%), Lebanese (84.3%, a difference of 0.010%), Immigrants from Syria (84.3%, a difference of 0.010%), Immigrants from Jordan (84.4%, a difference of 0.020%), and Chinese (84.3%, a difference of 0.020%).
| Demographics | Rating | Rank | In Labor Force | Age 25-29 |
| Immigrants | Cambodia | 14.3 /100 | #206 | Poor 84.4% |
| Immigrants | Armenia | 13.3 /100 | #207 | Poor 84.4% |
| Immigrants | Indonesia | 13.2 /100 | #208 | Poor 84.4% |
| Immigrants | Jordan | 12.8 /100 | #209 | Poor 84.4% |
| Chinese | 12.7 /100 | #210 | Poor 84.3% |
| Immigrants | Venezuela | 12.6 /100 | #211 | Poor 84.3% |
| Sub-Saharan Africans | 11.7 /100 | #212 | Poor 84.3% |
| Japanese | 11.4 /100 | #213 | Poor 84.3% |
| Lebanese | 11.1 /100 | #214 | Poor 84.3% |
| Immigrants | Syria | 10.7 /100 | #215 | Poor 84.3% |
| Israelis | 9.3 /100 | #216 | Tragic 84.3% |
| Immigrants | Ecuador | 9.3 /100 | #217 | Tragic 84.3% |
| Immigrants | Nigeria | 9.0 /100 | #218 | Tragic 84.3% |
| Immigrants | Saudi Arabia | 8.8 /100 | #219 | Tragic 84.3% |
| Nigerians | 7.2 /100 | #220 | Tragic 84.3% |
Demographics Similar to Jamaicans by In Labor Force | Age 25-29
In terms of in labor force | age 25-29, the demographic groups most similar to Jamaicans are Immigrants from Uzbekistan (83.9%, a difference of 0.0%), Trinidadian and Tobagonian (83.9%, a difference of 0.0%), Immigrants (83.9%, a difference of 0.030%), Alsatian (83.9%, a difference of 0.030%), and Iraqi (83.9%, a difference of 0.040%).
| Demographics | Rating | Rank | In Labor Force | Age 25-29 |
| Panamanians | 4.5 /100 | #232 | Tragic 84.2% |
| Immigrants | Western Asia | 2.7 /100 | #233 | Tragic 84.1% |
| Barbadians | 1.0 /100 | #234 | Tragic 83.9% |
| Iraqis | 0.9 /100 | #235 | Tragic 83.9% |
| Guamanians/Chamorros | 0.9 /100 | #236 | Tragic 83.9% |
| Immigrants | Immigrants | 0.9 /100 | #237 | Tragic 83.9% |
| Immigrants | Uzbekistan | 0.8 /100 | #238 | Tragic 83.9% |
| Jamaicans | 0.8 /100 | #239 | Tragic 83.9% |
| Trinidadians and Tobagonians | 0.7 /100 | #240 | Tragic 83.9% |
| Alsatians | 0.7 /100 | #241 | Tragic 83.9% |
| U.S. Virgin Islanders | 0.6 /100 | #242 | Tragic 83.8% |
| Salvadorans | 0.5 /100 | #243 | Tragic 83.8% |
| Immigrants | Jamaica | 0.4 /100 | #244 | Tragic 83.8% |
| Iroquois | 0.4 /100 | #245 | Tragic 83.8% |
| Cree | 0.3 /100 | #246 | Tragic 83.8% |