Ecuadorian vs Carpatho Rusyn In Labor Force | Age 25-29
COMPARE
Ecuadorian
Carpatho Rusyn
In Labor Force | Age 25-29
In Labor Force | Age 25-29 Comparison
Ecuadorians
Carpatho Rusyns
84.4%
IN LABOR FORCE | AGE 25-29
14.8/ 100
METRIC RATING
205th/ 347
METRIC RANK
87.0%
IN LABOR FORCE | AGE 25-29
100.0/ 100
METRIC RATING
4th/ 347
METRIC RANK
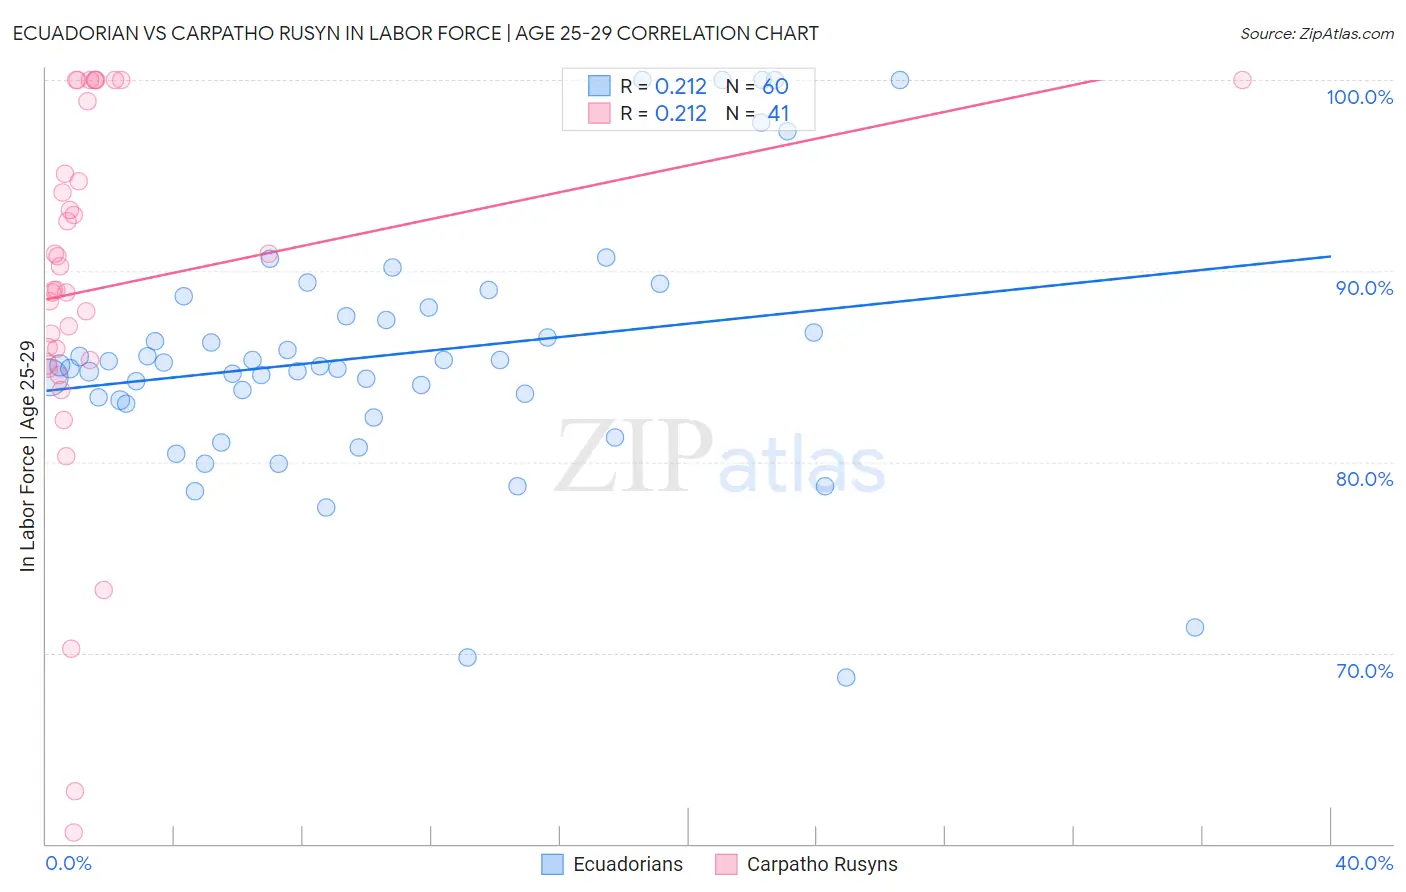
Ecuadorian vs Carpatho Rusyn In Labor Force | Age 25-29 Correlation Chart
The statistical analysis conducted on geographies consisting of 317,761,699 people shows a weak positive correlation between the proportion of Ecuadorians and labor force participation rate among population between the ages 25 and 29 in the United States with a correlation coefficient (R) of 0.212 and weighted average of 84.4%. Similarly, the statistical analysis conducted on geographies consisting of 58,870,912 people shows a weak positive correlation between the proportion of Carpatho Rusyns and labor force participation rate among population between the ages 25 and 29 in the United States with a correlation coefficient (R) of 0.212 and weighted average of 87.0%, a difference of 3.1%.
In Labor Force | Age 25-29 Correlation Summary
| Measurement | Ecuadorian | Carpatho Rusyn |
| Minimum | 68.7% | 60.6% |
| Maximum | 100.0% | 100.0% |
| Range | 31.3% | 39.4% |
| Mean | 85.6% | 89.1% |
| Median | 85.0% | 89.0% |
| Interquartile 25% (IQ1) | 83.1% | 85.2% |
| Interquartile 75% (IQ3) | 87.8% | 97.0% |
| Interquartile Range (IQR) | 4.7% | 11.8% |
| Standard Deviation (Sample) | 6.7% | 9.6% |
| Standard Deviation (Population) | 6.6% | 9.5% |
Similar Demographics by In Labor Force | Age 25-29
Demographics Similar to Ecuadorians by In Labor Force | Age 25-29
In terms of in labor force | age 25-29, the demographic groups most similar to Ecuadorians are Venezuelan (84.4%, a difference of 0.0%), Immigrants from Afghanistan (84.4%, a difference of 0.010%), Immigrants from Cambodia (84.4%, a difference of 0.010%), Laotian (84.4%, a difference of 0.020%), and Afghan (84.4%, a difference of 0.020%).
| Demographics | Rating | Rank | In Labor Force | Age 25-29 |
| Immigrants | Iraq | 19.0 /100 | #198 | Poor 84.4% |
| Immigrants | Germany | 18.3 /100 | #199 | Poor 84.4% |
| Immigrants | Kazakhstan | 17.5 /100 | #200 | Poor 84.4% |
| Laotians | 16.6 /100 | #201 | Poor 84.4% |
| Afghans | 15.9 /100 | #202 | Poor 84.4% |
| Immigrants | Afghanistan | 15.6 /100 | #203 | Poor 84.4% |
| Venezuelans | 15.1 /100 | #204 | Poor 84.4% |
| Ecuadorians | 14.8 /100 | #205 | Poor 84.4% |
| Immigrants | Cambodia | 14.3 /100 | #206 | Poor 84.4% |
| Immigrants | Armenia | 13.3 /100 | #207 | Poor 84.4% |
| Immigrants | Indonesia | 13.2 /100 | #208 | Poor 84.4% |
| Immigrants | Jordan | 12.8 /100 | #209 | Poor 84.4% |
| Chinese | 12.7 /100 | #210 | Poor 84.3% |
| Immigrants | Venezuela | 12.6 /100 | #211 | Poor 84.3% |
| Sub-Saharan Africans | 11.7 /100 | #212 | Poor 84.3% |
Demographics Similar to Carpatho Rusyns by In Labor Force | Age 25-29
In terms of in labor force | age 25-29, the demographic groups most similar to Carpatho Rusyns are Immigrants from Somalia (87.1%, a difference of 0.090%), Somali (87.1%, a difference of 0.090%), Luxembourger (86.9%, a difference of 0.10%), Slovene (86.4%, a difference of 0.72%), and Immigrants from Bosnia and Herzegovina (86.3%, a difference of 0.84%).
| Demographics | Rating | Rank | In Labor Force | Age 25-29 |
| Tsimshian | 100.0 /100 | #1 | Exceptional 88.7% |
| Immigrants | Somalia | 100.0 /100 | #2 | Exceptional 87.1% |
| Somalis | 100.0 /100 | #3 | Exceptional 87.1% |
| Carpatho Rusyns | 100.0 /100 | #4 | Exceptional 87.0% |
| Luxembourgers | 100.0 /100 | #5 | Exceptional 86.9% |
| Slovenes | 100.0 /100 | #6 | Exceptional 86.4% |
| Immigrants | Bosnia and Herzegovina | 100.0 /100 | #7 | Exceptional 86.3% |
| Immigrants | Cabo Verde | 100.0 /100 | #8 | Exceptional 86.2% |
| Ethiopians | 100.0 /100 | #9 | Exceptional 86.2% |
| Liberians | 100.0 /100 | #10 | Exceptional 86.1% |
| Immigrants | Ethiopia | 100.0 /100 | #11 | Exceptional 86.1% |
| Immigrants | Lithuania | 100.0 /100 | #12 | Exceptional 86.1% |
| Norwegians | 100.0 /100 | #13 | Exceptional 86.1% |
| Latvians | 100.0 /100 | #14 | Exceptional 86.1% |
| Bolivians | 100.0 /100 | #15 | Exceptional 86.1% |