Ecuadorian vs Immigrants from Denmark In Labor Force | Age 25-29
COMPARE
Ecuadorian
Immigrants from Denmark
In Labor Force | Age 25-29
In Labor Force | Age 25-29 Comparison
Ecuadorians
Immigrants from Denmark
84.4%
IN LABOR FORCE | AGE 25-29
14.8/ 100
METRIC RATING
205th/ 347
METRIC RANK
84.6%
IN LABOR FORCE | AGE 25-29
37.0/ 100
METRIC RATING
185th/ 347
METRIC RANK
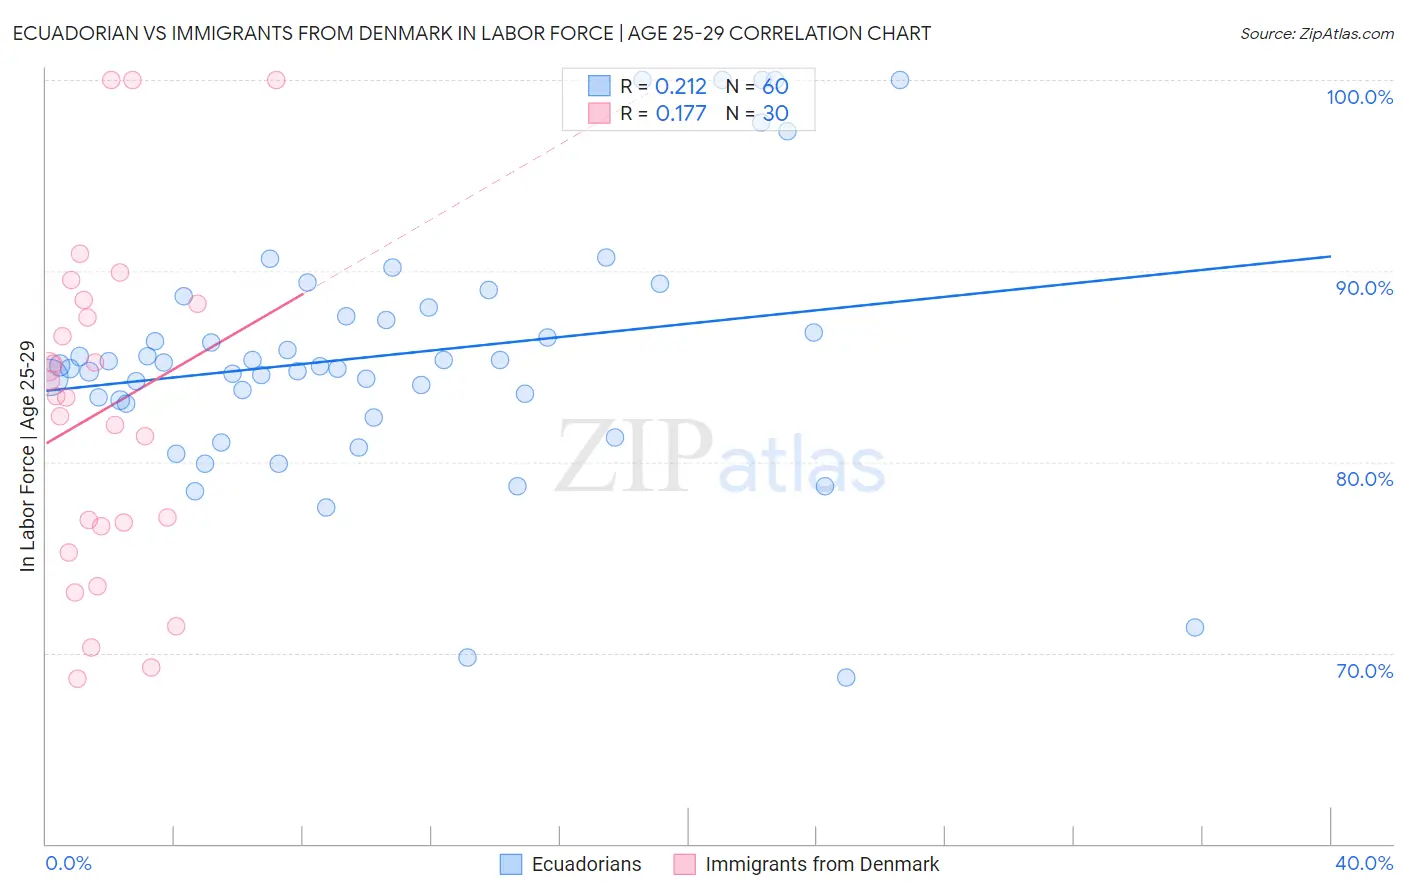
Ecuadorian vs Immigrants from Denmark In Labor Force | Age 25-29 Correlation Chart
The statistical analysis conducted on geographies consisting of 317,761,699 people shows a weak positive correlation between the proportion of Ecuadorians and labor force participation rate among population between the ages 25 and 29 in the United States with a correlation coefficient (R) of 0.212 and weighted average of 84.4%. Similarly, the statistical analysis conducted on geographies consisting of 136,409,678 people shows a poor positive correlation between the proportion of Immigrants from Denmark and labor force participation rate among population between the ages 25 and 29 in the United States with a correlation coefficient (R) of 0.177 and weighted average of 84.6%, a difference of 0.23%.
In Labor Force | Age 25-29 Correlation Summary
| Measurement | Ecuadorian | Immigrants from Denmark |
| Minimum | 68.7% | 68.7% |
| Maximum | 100.0% | 100.0% |
| Range | 31.3% | 31.3% |
| Mean | 85.6% | 82.7% |
| Median | 85.0% | 83.4% |
| Interquartile 25% (IQ1) | 83.1% | 76.6% |
| Interquartile 75% (IQ3) | 87.8% | 88.3% |
| Interquartile Range (IQR) | 4.7% | 11.7% |
| Standard Deviation (Sample) | 6.7% | 8.7% |
| Standard Deviation (Population) | 6.6% | 8.6% |
Demographics Similar to Ecuadorians and Immigrants from Denmark by In Labor Force | Age 25-29
In terms of in labor force | age 25-29, the demographic groups most similar to Ecuadorians are Venezuelan (84.4%, a difference of 0.0%), Immigrants from Afghanistan (84.4%, a difference of 0.010%), Laotian (84.4%, a difference of 0.020%), Afghan (84.4%, a difference of 0.020%), and Immigrants from Kazakhstan (84.4%, a difference of 0.040%). Similarly, the demographic groups most similar to Immigrants from Denmark are Immigrants from Belgium (84.6%, a difference of 0.020%), Immigrants from Portugal (84.6%, a difference of 0.020%), Immigrants from Ukraine (84.5%, a difference of 0.030%), Moroccan (84.5%, a difference of 0.040%), and Welsh (84.5%, a difference of 0.050%).
| Demographics | Rating | Rank | In Labor Force | Age 25-29 |
| Immigrants | Denmark | 37.0 /100 | #185 | Fair 84.6% |
| Immigrants | Belgium | 35.0 /100 | #186 | Fair 84.6% |
| Immigrants | Portugal | 34.7 /100 | #187 | Fair 84.6% |
| Immigrants | Ukraine | 33.7 /100 | #188 | Fair 84.5% |
| Moroccans | 32.6 /100 | #189 | Fair 84.5% |
| Welsh | 31.1 /100 | #190 | Fair 84.5% |
| Zimbabweans | 28.7 /100 | #191 | Fair 84.5% |
| English | 25.8 /100 | #192 | Fair 84.5% |
| South American Indians | 25.0 /100 | #193 | Fair 84.5% |
| Portuguese | 21.2 /100 | #194 | Fair 84.4% |
| Immigrants | Israel | 20.8 /100 | #195 | Fair 84.4% |
| Immigrants | South Eastern Asia | 19.5 /100 | #196 | Poor 84.4% |
| Tlingit-Haida | 19.3 /100 | #197 | Poor 84.4% |
| Immigrants | Iraq | 19.0 /100 | #198 | Poor 84.4% |
| Immigrants | Germany | 18.3 /100 | #199 | Poor 84.4% |
| Immigrants | Kazakhstan | 17.5 /100 | #200 | Poor 84.4% |
| Laotians | 16.6 /100 | #201 | Poor 84.4% |
| Afghans | 15.9 /100 | #202 | Poor 84.4% |
| Immigrants | Afghanistan | 15.6 /100 | #203 | Poor 84.4% |
| Venezuelans | 15.1 /100 | #204 | Poor 84.4% |
| Ecuadorians | 14.8 /100 | #205 | Poor 84.4% |