Ecuadorian vs Jamaican 10th Grade
COMPARE
Ecuadorian
Jamaican
10th Grade
10th Grade Comparison
Ecuadorians
Jamaicans
90.6%
10TH GRADE
0.0/ 100
METRIC RATING
316th/ 347
METRIC RANK
92.8%
10TH GRADE
1.2/ 100
METRIC RATING
250th/ 347
METRIC RANK
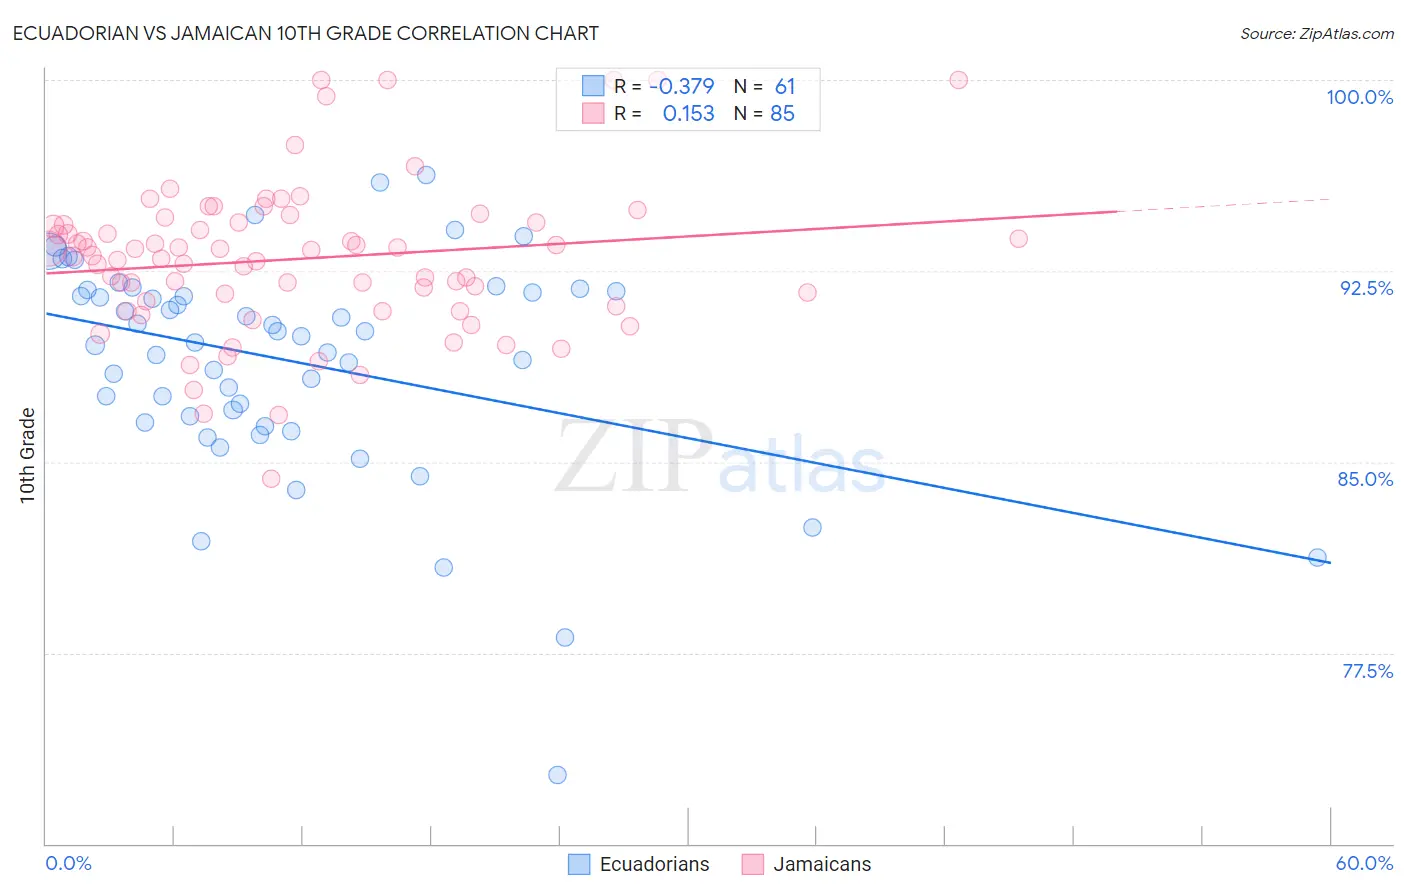
Ecuadorian vs Jamaican 10th Grade Correlation Chart
The statistical analysis conducted on geographies consisting of 317,864,750 people shows a mild negative correlation between the proportion of Ecuadorians and percentage of population with at least 10th grade education in the United States with a correlation coefficient (R) of -0.379 and weighted average of 90.6%. Similarly, the statistical analysis conducted on geographies consisting of 368,084,732 people shows a poor positive correlation between the proportion of Jamaicans and percentage of population with at least 10th grade education in the United States with a correlation coefficient (R) of 0.153 and weighted average of 92.8%, a difference of 2.4%.
10th Grade Correlation Summary
| Measurement | Ecuadorian | Jamaican |
| Minimum | 72.7% | 84.4% |
| Maximum | 96.2% | 100.0% |
| Range | 23.5% | 15.6% |
| Mean | 89.0% | 93.0% |
| Median | 89.9% | 93.1% |
| Interquartile 25% (IQ1) | 86.7% | 91.2% |
| Interquartile 75% (IQ3) | 91.7% | 94.4% |
| Interquartile Range (IQR) | 5.1% | 3.2% |
| Standard Deviation (Sample) | 4.3% | 3.0% |
| Standard Deviation (Population) | 4.3% | 3.0% |
Similar Demographics by 10th Grade
Demographics Similar to Ecuadorians by 10th Grade
In terms of 10th grade, the demographic groups most similar to Ecuadorians are Immigrants from Caribbean (90.6%, a difference of 0.010%), Nepalese (90.7%, a difference of 0.090%), Cape Verdean (90.8%, a difference of 0.17%), Immigrants from Ecuador (90.4%, a difference of 0.17%), and Immigrants from Portugal (90.8%, a difference of 0.20%).
| Demographics | Rating | Rank | 10th Grade |
| Immigrants | Immigrants | 0.0 /100 | #309 | Tragic 91.0% |
| Vietnamese | 0.0 /100 | #310 | Tragic 90.9% |
| Immigrants | Cambodia | 0.0 /100 | #311 | Tragic 90.9% |
| Immigrants | Portugal | 0.0 /100 | #312 | Tragic 90.8% |
| Cape Verdeans | 0.0 /100 | #313 | Tragic 90.8% |
| Nepalese | 0.0 /100 | #314 | Tragic 90.7% |
| Immigrants | Caribbean | 0.0 /100 | #315 | Tragic 90.6% |
| Ecuadorians | 0.0 /100 | #316 | Tragic 90.6% |
| Immigrants | Ecuador | 0.0 /100 | #317 | Tragic 90.4% |
| Immigrants | Cuba | 0.0 /100 | #318 | Tragic 90.2% |
| Nicaraguans | 0.0 /100 | #319 | Tragic 90.2% |
| Houma | 0.0 /100 | #320 | Tragic 90.2% |
| Belizeans | 0.0 /100 | #321 | Tragic 90.2% |
| Tohono O'odham | 0.0 /100 | #322 | Tragic 90.1% |
| Immigrants | Belize | 0.0 /100 | #323 | Tragic 90.1% |
Demographics Similar to Jamaicans by 10th Grade
In terms of 10th grade, the demographic groups most similar to Jamaicans are Immigrants from Senegal (92.8%, a difference of 0.020%), Colombian (92.8%, a difference of 0.030%), Immigrants from Afghanistan (92.8%, a difference of 0.040%), Immigrants from Thailand (92.8%, a difference of 0.050%), and South American (92.8%, a difference of 0.060%).
| Demographics | Rating | Rank | 10th Grade |
| Senegalese | 2.4 /100 | #243 | Tragic 93.0% |
| Spanish Americans | 2.1 /100 | #244 | Tragic 92.9% |
| Uruguayans | 1.8 /100 | #245 | Tragic 92.9% |
| Immigrants | Middle Africa | 1.7 /100 | #246 | Tragic 92.9% |
| Immigrants | Afghanistan | 1.4 /100 | #247 | Tragic 92.8% |
| Colombians | 1.4 /100 | #248 | Tragic 92.8% |
| Immigrants | Senegal | 1.4 /100 | #249 | Tragic 92.8% |
| Jamaicans | 1.2 /100 | #250 | Tragic 92.8% |
| Immigrants | Thailand | 1.0 /100 | #251 | Tragic 92.8% |
| South Americans | 0.9 /100 | #252 | Tragic 92.8% |
| Ghanaians | 0.9 /100 | #253 | Tragic 92.8% |
| Armenians | 0.9 /100 | #254 | Tragic 92.7% |
| Immigrants | Bolivia | 0.7 /100 | #255 | Tragic 92.7% |
| Immigrants | Nigeria | 0.7 /100 | #256 | Tragic 92.7% |
| U.S. Virgin Islanders | 0.7 /100 | #257 | Tragic 92.7% |