Ecuadorian vs Carpatho Rusyn Householder Income Ages 45 - 64 years
COMPARE
Ecuadorian
Carpatho Rusyn
Householder Income Ages 45 - 64 years
Householder Income Ages 45 - 64 years Comparison
Ecuadorians
Carpatho Rusyns
$93,739
HOUSEHOLDER INCOME AGES 45 - 64 YEARS
3.6/ 100
METRIC RATING
231st/ 347
METRIC RANK
$102,777
HOUSEHOLDER INCOME AGES 45 - 64 YEARS
77.4/ 100
METRIC RATING
156th/ 347
METRIC RANK
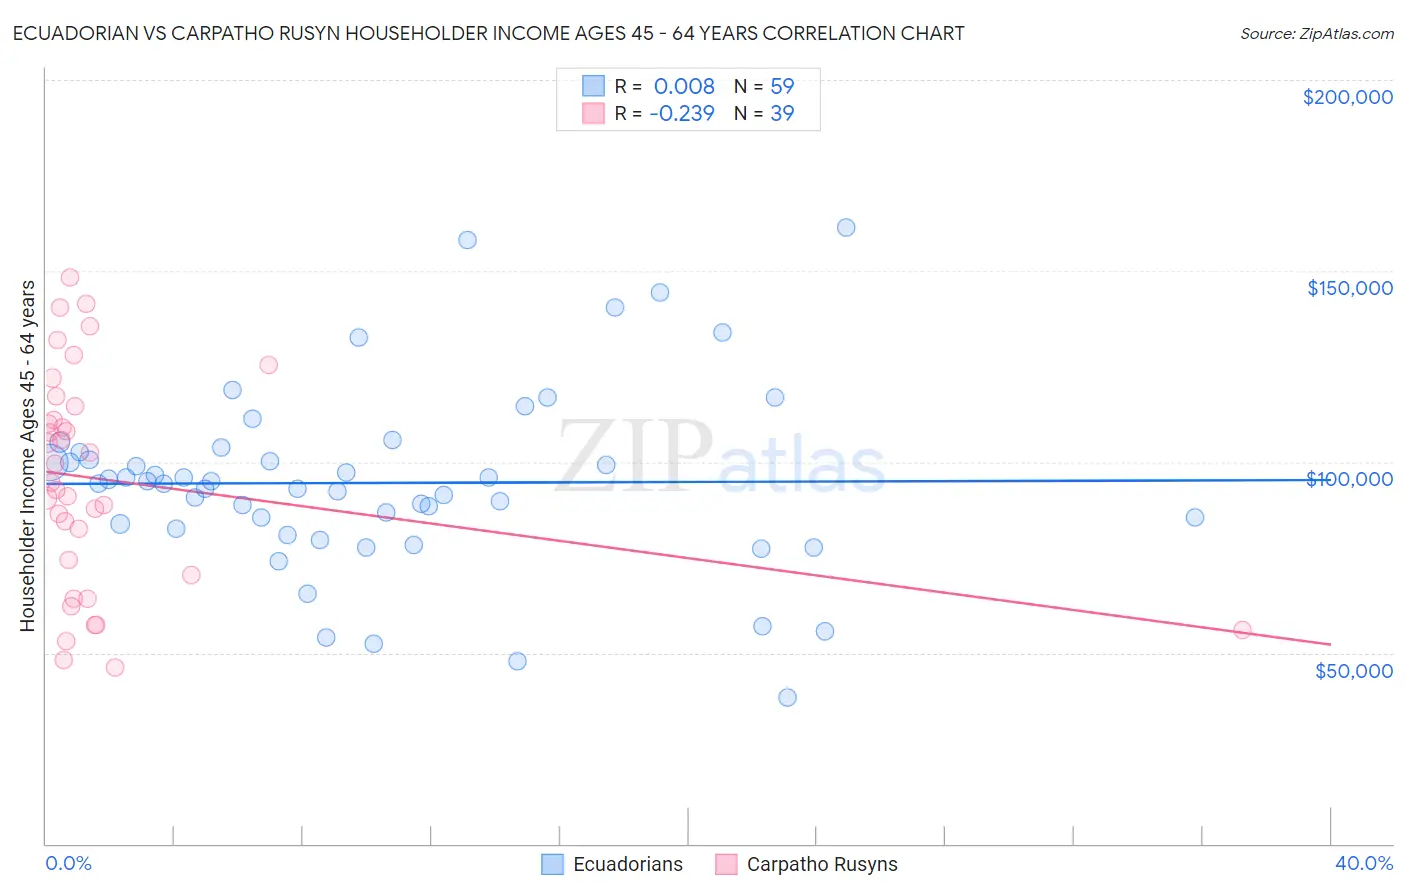
Ecuadorian vs Carpatho Rusyn Householder Income Ages 45 - 64 years Correlation Chart
The statistical analysis conducted on geographies consisting of 317,361,637 people shows no correlation between the proportion of Ecuadorians and household income with householder between the ages 45 and 64 in the United States with a correlation coefficient (R) of 0.008 and weighted average of $93,739. Similarly, the statistical analysis conducted on geographies consisting of 58,863,567 people shows a weak negative correlation between the proportion of Carpatho Rusyns and household income with householder between the ages 45 and 64 in the United States with a correlation coefficient (R) of -0.239 and weighted average of $102,777, a difference of 9.6%.
Householder Income Ages 45 - 64 years Correlation Summary
| Measurement | Ecuadorian | Carpatho Rusyn |
| Minimum | $38,250 | $46,000 |
| Maximum | $161,315 | $148,438 |
| Range | $123,065 | $102,438 |
| Mean | $94,502 | $95,246 |
| Median | $94,317 | $94,602 |
| Interquartile 25% (IQ1) | $82,422 | $70,250 |
| Interquartile 75% (IQ3) | $102,541 | $114,408 |
| Interquartile Range (IQR) | $20,119 | $44,158 |
| Standard Deviation (Sample) | $24,241 | $28,203 |
| Standard Deviation (Population) | $24,034 | $27,839 |
Similar Demographics by Householder Income Ages 45 - 64 years
Demographics Similar to Ecuadorians by Householder Income Ages 45 - 64 years
In terms of householder income ages 45 - 64 years, the demographic groups most similar to Ecuadorians are Sudanese ($93,718, a difference of 0.020%), Immigrants from Sudan ($93,781, a difference of 0.040%), Vietnamese ($93,788, a difference of 0.050%), Immigrants from Panama ($93,815, a difference of 0.080%), and Alaska Native ($93,991, a difference of 0.27%).
| Demographics | Rating | Rank | Householder Income Ages 45 - 64 years |
| Immigrants | Bosnia and Herzegovina | 4.6 /100 | #224 | Tragic $94,288 |
| Bermudans | 4.4 /100 | #225 | Tragic $94,197 |
| Immigrants | Azores | 4.3 /100 | #226 | Tragic $94,138 |
| Alaska Natives | 4.0 /100 | #227 | Tragic $93,991 |
| Immigrants | Panama | 3.7 /100 | #228 | Tragic $93,815 |
| Vietnamese | 3.6 /100 | #229 | Tragic $93,788 |
| Immigrants | Sudan | 3.6 /100 | #230 | Tragic $93,781 |
| Ecuadorians | 3.6 /100 | #231 | Tragic $93,739 |
| Sudanese | 3.5 /100 | #232 | Tragic $93,718 |
| Nepalese | 3.0 /100 | #233 | Tragic $93,355 |
| Immigrants | El Salvador | 2.7 /100 | #234 | Tragic $93,176 |
| Nicaraguans | 2.0 /100 | #235 | Tragic $92,554 |
| Immigrants | Western Africa | 1.8 /100 | #236 | Tragic $92,384 |
| Immigrants | Bangladesh | 1.7 /100 | #237 | Tragic $92,208 |
| Pennsylvania Germans | 1.5 /100 | #238 | Tragic $91,956 |
Demographics Similar to Carpatho Rusyns by Householder Income Ages 45 - 64 years
In terms of householder income ages 45 - 64 years, the demographic groups most similar to Carpatho Rusyns are Costa Rican ($102,779, a difference of 0.0%), Immigrants from Ethiopia ($102,763, a difference of 0.010%), Slovene ($102,885, a difference of 0.11%), Slavic ($102,629, a difference of 0.14%), and Scandinavian ($102,969, a difference of 0.19%).
| Demographics | Rating | Rank | Householder Income Ages 45 - 64 years |
| Immigrants | Sierra Leone | 81.1 /100 | #149 | Excellent $103,227 |
| Immigrants | Peru | 80.7 /100 | #150 | Excellent $103,173 |
| Swiss | 79.9 /100 | #151 | Good $103,071 |
| Irish | 79.8 /100 | #152 | Good $103,067 |
| Scandinavians | 79.0 /100 | #153 | Good $102,969 |
| Slovenes | 78.3 /100 | #154 | Good $102,885 |
| Costa Ricans | 77.4 /100 | #155 | Good $102,779 |
| Carpatho Rusyns | 77.4 /100 | #156 | Good $102,777 |
| Immigrants | Ethiopia | 77.3 /100 | #157 | Good $102,763 |
| Slavs | 76.1 /100 | #158 | Good $102,629 |
| Sierra Leoneans | 74.2 /100 | #159 | Good $102,427 |
| Icelanders | 72.5 /100 | #160 | Good $102,261 |
| Immigrants | Nepal | 71.8 /100 | #161 | Good $102,190 |
| Scottish | 71.1 /100 | #162 | Good $102,123 |
| English | 70.1 /100 | #163 | Good $102,021 |