Ecuadorian vs Hawaiian In Labor Force | Age 35-44
COMPARE
Ecuadorian
Hawaiian
In Labor Force | Age 35-44
In Labor Force | Age 35-44 Comparison
Ecuadorians
Hawaiians
84.2%
IN LABOR FORCE | AGE 35-44
24.0/ 100
METRIC RATING
198th/ 347
METRIC RANK
83.2%
IN LABOR FORCE | AGE 35-44
0.0/ 100
METRIC RATING
275th/ 347
METRIC RANK
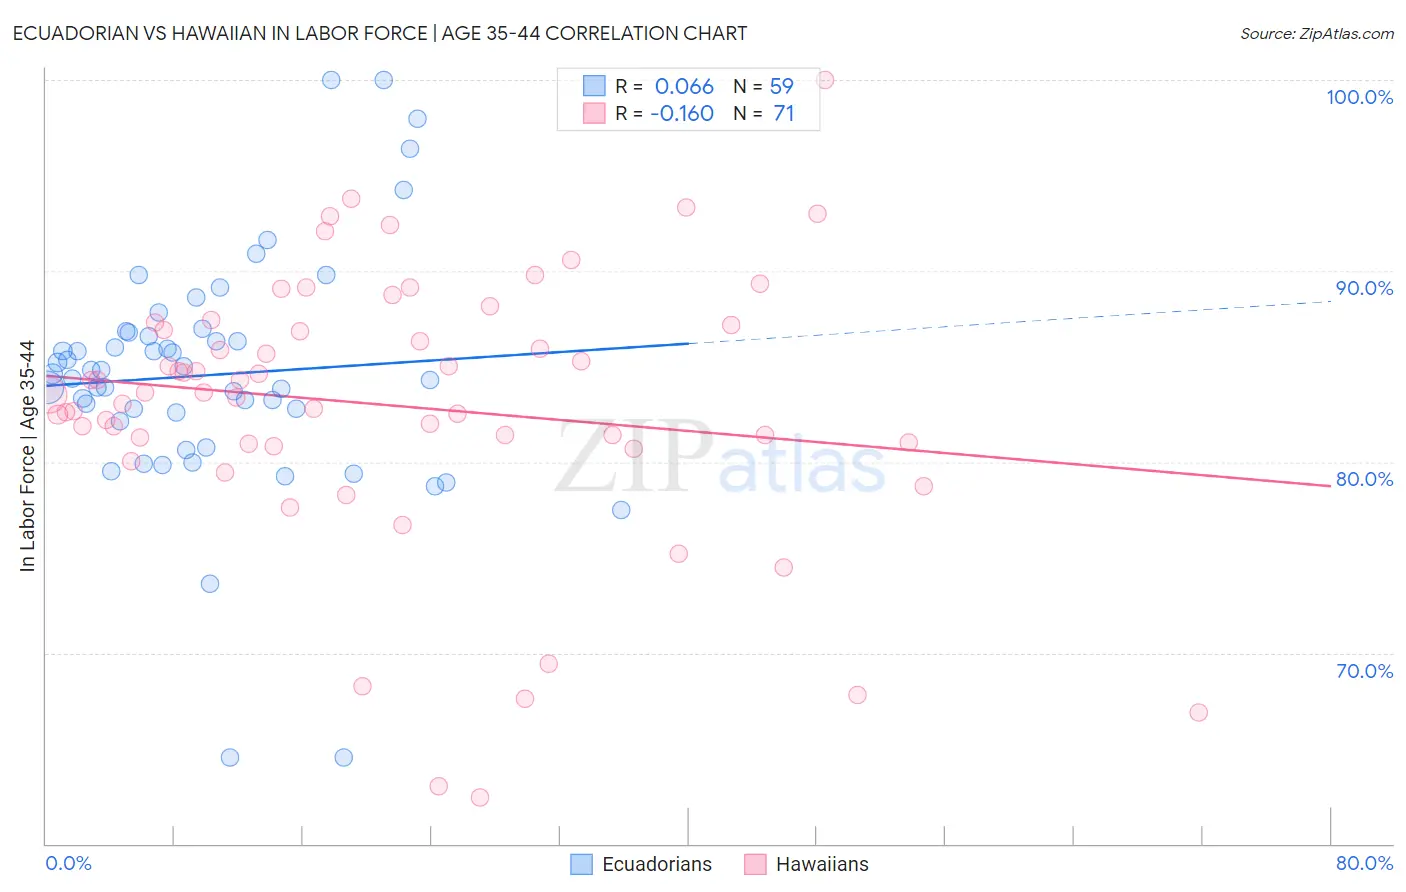
Ecuadorian vs Hawaiian In Labor Force | Age 35-44 Correlation Chart
The statistical analysis conducted on geographies consisting of 317,693,933 people shows a slight positive correlation between the proportion of Ecuadorians and labor force participation rate among population between the ages 35 and 44 in the United States with a correlation coefficient (R) of 0.066 and weighted average of 84.2%. Similarly, the statistical analysis conducted on geographies consisting of 327,486,106 people shows a poor negative correlation between the proportion of Hawaiians and labor force participation rate among population between the ages 35 and 44 in the United States with a correlation coefficient (R) of -0.160 and weighted average of 83.2%, a difference of 1.2%.
In Labor Force | Age 35-44 Correlation Summary
| Measurement | Ecuadorian | Hawaiian |
| Minimum | 64.5% | 62.4% |
| Maximum | 100.0% | 100.0% |
| Range | 35.5% | 37.6% |
| Mean | 84.6% | 83.0% |
| Median | 84.6% | 83.6% |
| Interquartile 25% (IQ1) | 82.1% | 80.9% |
| Interquartile 75% (IQ3) | 86.8% | 87.2% |
| Interquartile Range (IQR) | 4.7% | 6.3% |
| Standard Deviation (Sample) | 6.4% | 7.2% |
| Standard Deviation (Population) | 6.3% | 7.1% |
Similar Demographics by In Labor Force | Age 35-44
Demographics Similar to Ecuadorians by In Labor Force | Age 35-44
In terms of in labor force | age 35-44, the demographic groups most similar to Ecuadorians are Immigrants from Caribbean (84.2%, a difference of 0.010%), Immigrants from England (84.2%, a difference of 0.010%), Immigrants from Western Europe (84.2%, a difference of 0.010%), Syrian (84.2%, a difference of 0.010%), and Moroccan (84.2%, a difference of 0.010%).
| Demographics | Rating | Rank | In Labor Force | Age 35-44 |
| Immigrants | Philippines | 27.9 /100 | #191 | Fair 84.2% |
| Immigrants | Vietnam | 27.4 /100 | #192 | Fair 84.2% |
| Hungarians | 26.8 /100 | #193 | Fair 84.2% |
| Immigrants | Indonesia | 25.7 /100 | #194 | Fair 84.2% |
| Immigrants | Caribbean | 25.7 /100 | #195 | Fair 84.2% |
| Immigrants | England | 25.0 /100 | #196 | Fair 84.2% |
| Immigrants | Western Europe | 24.7 /100 | #197 | Fair 84.2% |
| Ecuadorians | 24.0 /100 | #198 | Fair 84.2% |
| Syrians | 23.2 /100 | #199 | Fair 84.2% |
| Moroccans | 23.2 /100 | #200 | Fair 84.2% |
| British | 23.0 /100 | #201 | Fair 84.2% |
| Immigrants | Uzbekistan | 22.8 /100 | #202 | Fair 84.2% |
| Immigrants | South Eastern Asia | 22.4 /100 | #203 | Fair 84.2% |
| Canadians | 19.9 /100 | #204 | Poor 84.2% |
| Immigrants | Canada | 19.6 /100 | #205 | Poor 84.2% |
Demographics Similar to Hawaiians by In Labor Force | Age 35-44
In terms of in labor force | age 35-44, the demographic groups most similar to Hawaiians are Delaware (83.2%, a difference of 0.010%), Nonimmigrants (83.2%, a difference of 0.020%), Samoan (83.2%, a difference of 0.020%), Immigrants from Fiji (83.2%, a difference of 0.030%), and Spanish (83.2%, a difference of 0.030%).
| Demographics | Rating | Rank | In Labor Force | Age 35-44 |
| Hondurans | 0.1 /100 | #268 | Tragic 83.4% |
| Immigrants | Grenada | 0.1 /100 | #269 | Tragic 83.3% |
| Immigrants | Honduras | 0.0 /100 | #270 | Tragic 83.3% |
| French American Indians | 0.0 /100 | #271 | Tragic 83.2% |
| Immigrants | Fiji | 0.0 /100 | #272 | Tragic 83.2% |
| Spanish | 0.0 /100 | #273 | Tragic 83.2% |
| Immigrants | Nonimmigrants | 0.0 /100 | #274 | Tragic 83.2% |
| Hawaiians | 0.0 /100 | #275 | Tragic 83.2% |
| Delaware | 0.0 /100 | #276 | Tragic 83.2% |
| Samoans | 0.0 /100 | #277 | Tragic 83.2% |
| Belizeans | 0.0 /100 | #278 | Tragic 83.1% |
| Immigrants | Micronesia | 0.0 /100 | #279 | Tragic 83.1% |
| Dominicans | 0.0 /100 | #280 | Tragic 83.1% |
| Guatemalans | 0.0 /100 | #281 | Tragic 83.0% |
| Osage | 0.0 /100 | #282 | Tragic 82.9% |