Sierra Leonean vs Albanian In Labor Force | Age 20-24
COMPARE
Sierra Leonean
Albanian
In Labor Force | Age 20-24
In Labor Force | Age 20-24 Comparison
Sierra Leoneans
Albanians
76.3%
IN LABOR FORCE | AGE 20-24
99.0/ 100
METRIC RATING
91st/ 347
METRIC RANK
74.6%
IN LABOR FORCE | AGE 20-24
16.2/ 100
METRIC RATING
207th/ 347
METRIC RANK
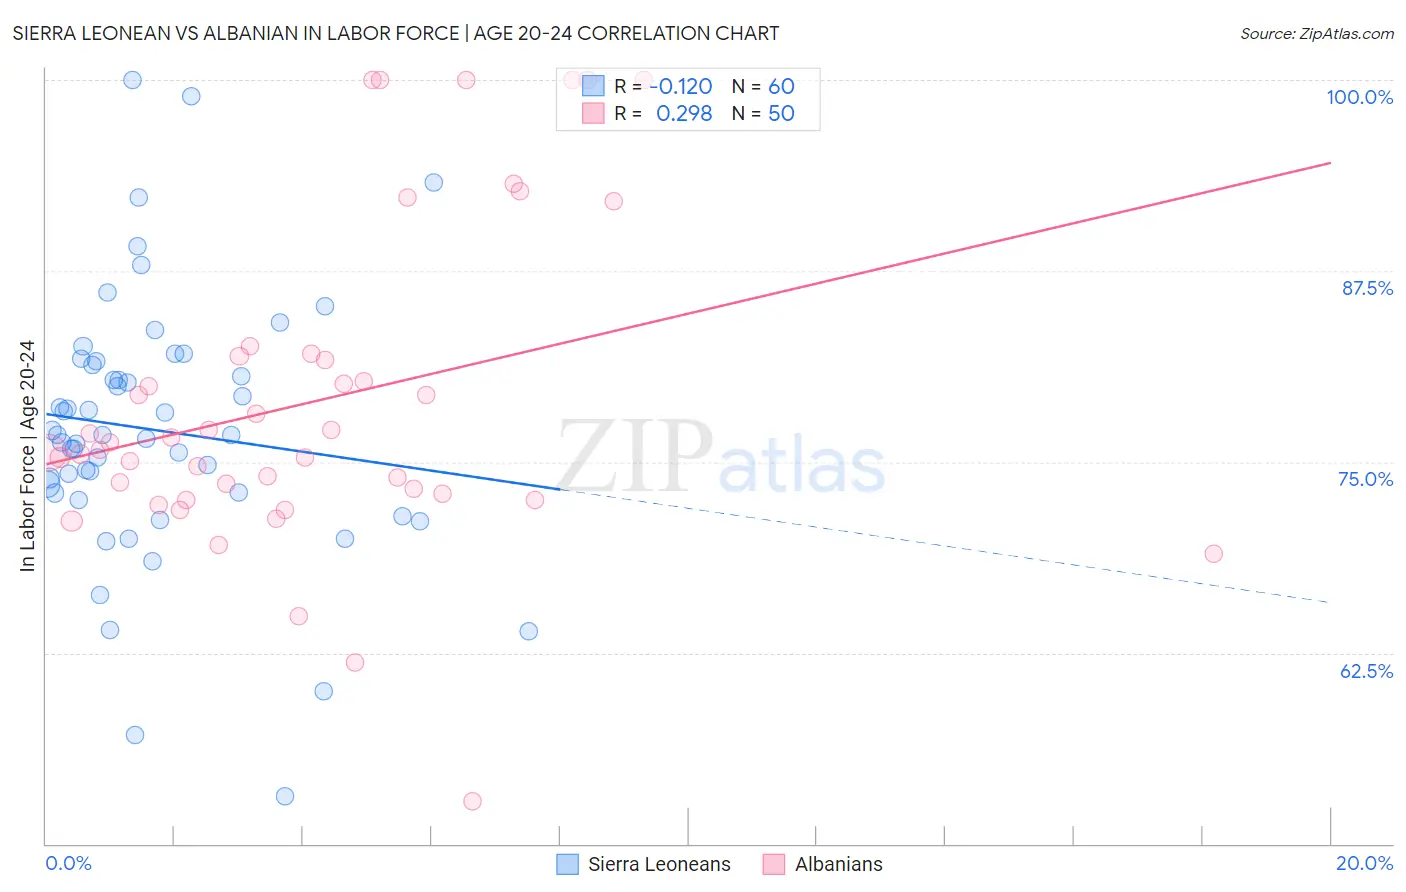
Sierra Leonean vs Albanian In Labor Force | Age 20-24 Correlation Chart
The statistical analysis conducted on geographies consisting of 83,361,701 people shows a poor negative correlation between the proportion of Sierra Leoneans and labor force participation rate among population between the ages 20 and 24 in the United States with a correlation coefficient (R) of -0.120 and weighted average of 76.3%. Similarly, the statistical analysis conducted on geographies consisting of 193,237,710 people shows a weak positive correlation between the proportion of Albanians and labor force participation rate among population between the ages 20 and 24 in the United States with a correlation coefficient (R) of 0.298 and weighted average of 74.6%, a difference of 2.3%.
In Labor Force | Age 20-24 Correlation Summary
| Measurement | Sierra Leonean | Albanian |
| Minimum | 53.1% | 52.8% |
| Maximum | 100.0% | 100.0% |
| Range | 46.9% | 47.2% |
| Mean | 77.1% | 79.0% |
| Median | 76.8% | 76.0% |
| Interquartile 25% (IQ1) | 73.0% | 72.9% |
| Interquartile 75% (IQ3) | 81.5% | 81.9% |
| Interquartile Range (IQR) | 8.5% | 9.0% |
| Standard Deviation (Sample) | 8.6% | 10.5% |
| Standard Deviation (Population) | 8.5% | 10.4% |
Similar Demographics by In Labor Force | Age 20-24
Demographics Similar to Sierra Leoneans by In Labor Force | Age 20-24
In terms of in labor force | age 20-24, the demographic groups most similar to Sierra Leoneans are Immigrants from Burma/Myanmar (76.3%, a difference of 0.020%), Maltese (76.3%, a difference of 0.030%), Hungarian (76.3%, a difference of 0.050%), Bulgarian (76.4%, a difference of 0.060%), and Spanish (76.4%, a difference of 0.070%).
| Demographics | Rating | Rank | In Labor Force | Age 20-24 |
| Austrians | 99.4 /100 | #84 | Exceptional 76.5% |
| Portuguese | 99.3 /100 | #85 | Exceptional 76.4% |
| Immigrants | Iraq | 99.3 /100 | #86 | Exceptional 76.4% |
| Immigrants | Thailand | 99.3 /100 | #87 | Exceptional 76.4% |
| Spanish | 99.2 /100 | #88 | Exceptional 76.4% |
| Bulgarians | 99.2 /100 | #89 | Exceptional 76.4% |
| Immigrants | Burma/Myanmar | 99.1 /100 | #90 | Exceptional 76.3% |
| Sierra Leoneans | 99.0 /100 | #91 | Exceptional 76.3% |
| Maltese | 98.9 /100 | #92 | Exceptional 76.3% |
| Hungarians | 98.9 /100 | #93 | Exceptional 76.3% |
| Potawatomi | 98.5 /100 | #94 | Exceptional 76.2% |
| Immigrants | Germany | 98.5 /100 | #95 | Exceptional 76.2% |
| Immigrants | Nonimmigrants | 98.5 /100 | #96 | Exceptional 76.2% |
| Immigrants | Lithuania | 98.0 /100 | #97 | Exceptional 76.1% |
| Immigrants | Oceania | 98.0 /100 | #98 | Exceptional 76.1% |
Demographics Similar to Albanians by In Labor Force | Age 20-24
In terms of in labor force | age 20-24, the demographic groups most similar to Albanians are Immigrants from Uruguay (74.6%, a difference of 0.010%), Arab (74.6%, a difference of 0.010%), Sioux (74.6%, a difference of 0.030%), Uruguayan (74.6%, a difference of 0.030%), and Immigrants from Northern Africa (74.6%, a difference of 0.040%).
| Demographics | Rating | Rank | In Labor Force | Age 20-24 |
| Nigerians | 21.9 /100 | #200 | Fair 74.7% |
| Choctaw | 21.4 /100 | #201 | Fair 74.7% |
| Moroccans | 20.4 /100 | #202 | Fair 74.7% |
| Immigrants | Northern Africa | 17.9 /100 | #203 | Poor 74.6% |
| Immigrants | Italy | 17.6 /100 | #204 | Poor 74.6% |
| Inupiat | 17.6 /100 | #205 | Poor 74.6% |
| Sioux | 17.5 /100 | #206 | Poor 74.6% |
| Albanians | 16.2 /100 | #207 | Poor 74.6% |
| Immigrants | Uruguay | 15.8 /100 | #208 | Poor 74.6% |
| Arabs | 15.8 /100 | #209 | Poor 74.6% |
| Uruguayans | 15.1 /100 | #210 | Poor 74.6% |
| Immigrants | Australia | 14.7 /100 | #211 | Poor 74.6% |
| Creek | 13.3 /100 | #212 | Poor 74.5% |
| Peruvians | 13.3 /100 | #213 | Poor 74.5% |
| Immigrants | Southern Europe | 13.2 /100 | #214 | Poor 74.5% |