Immigrants from South Africa vs Albanian In Labor Force | Age 20-24
COMPARE
Immigrants from South Africa
Albanian
In Labor Force | Age 20-24
In Labor Force | Age 20-24 Comparison
Immigrants from South Africa
Albanians
74.9%
IN LABOR FORCE | AGE 20-24
36.9/ 100
METRIC RATING
182nd/ 347
METRIC RANK
74.6%
IN LABOR FORCE | AGE 20-24
16.2/ 100
METRIC RATING
207th/ 347
METRIC RANK
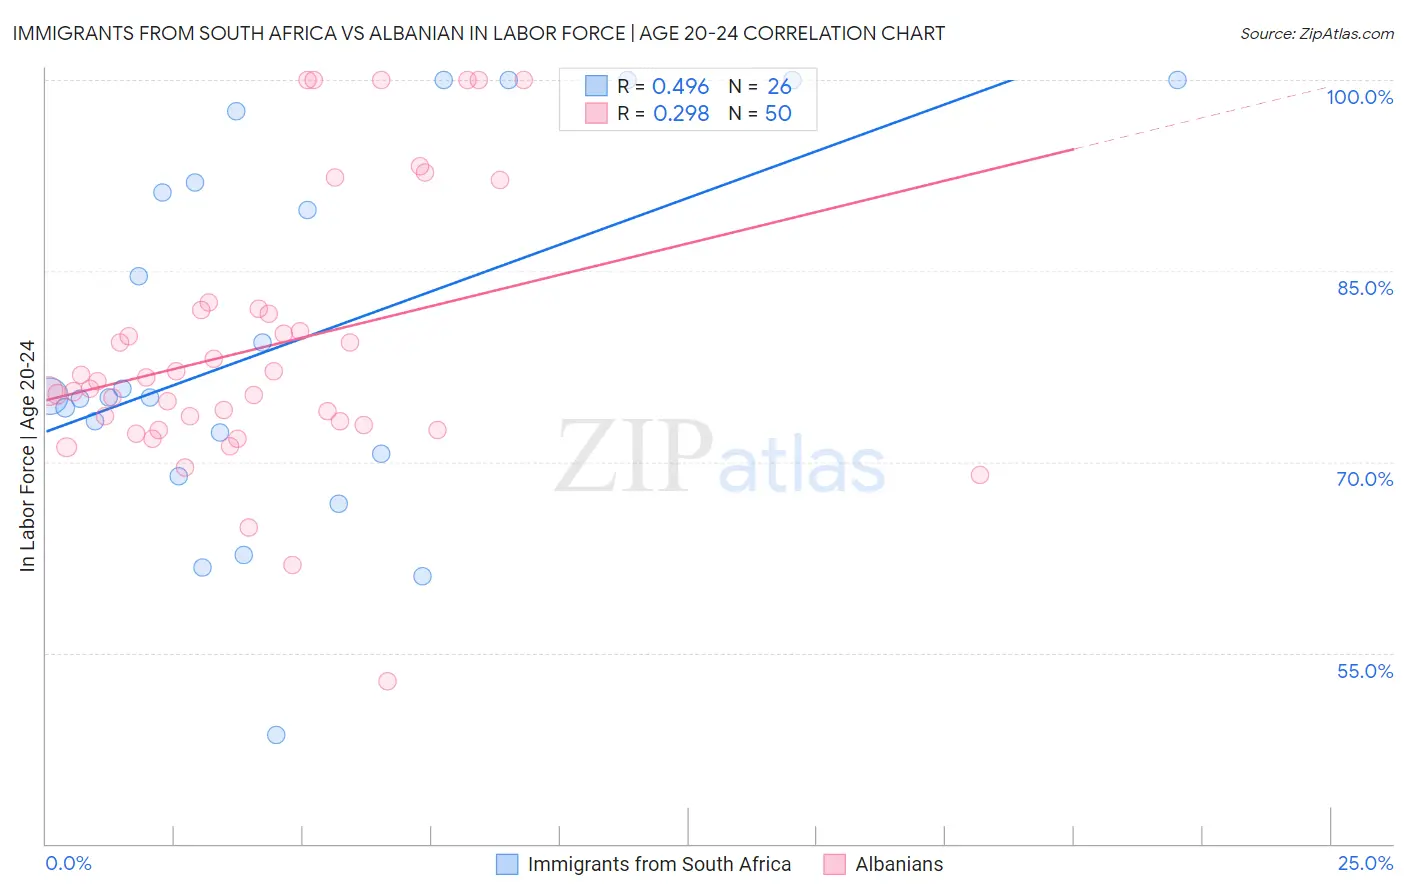
Immigrants from South Africa vs Albanian In Labor Force | Age 20-24 Correlation Chart
The statistical analysis conducted on geographies consisting of 233,228,799 people shows a moderate positive correlation between the proportion of Immigrants from South Africa and labor force participation rate among population between the ages 20 and 24 in the United States with a correlation coefficient (R) of 0.496 and weighted average of 74.9%. Similarly, the statistical analysis conducted on geographies consisting of 193,237,710 people shows a weak positive correlation between the proportion of Albanians and labor force participation rate among population between the ages 20 and 24 in the United States with a correlation coefficient (R) of 0.298 and weighted average of 74.6%, a difference of 0.41%.
In Labor Force | Age 20-24 Correlation Summary
| Measurement | Immigrants from South Africa | Albanian |
| Minimum | 48.5% | 52.8% |
| Maximum | 100.0% | 100.0% |
| Range | 51.5% | 47.2% |
| Mean | 79.6% | 79.0% |
| Median | 75.1% | 76.0% |
| Interquartile 25% (IQ1) | 70.6% | 72.9% |
| Interquartile 75% (IQ3) | 92.0% | 81.9% |
| Interquartile Range (IQR) | 21.4% | 9.0% |
| Standard Deviation (Sample) | 14.6% | 10.5% |
| Standard Deviation (Population) | 14.3% | 10.4% |
Similar Demographics by In Labor Force | Age 20-24
Demographics Similar to Immigrants from South Africa by In Labor Force | Age 20-24
In terms of in labor force | age 20-24, the demographic groups most similar to Immigrants from South Africa are Immigrants from Costa Rica (74.9%, a difference of 0.0%), Immigrants from Hungary (74.9%, a difference of 0.030%), Sri Lankan (74.9%, a difference of 0.030%), Immigrants from Eastern Europe (74.9%, a difference of 0.050%), and Immigrants from Honduras (74.9%, a difference of 0.060%).
| Demographics | Rating | Rank | In Labor Force | Age 20-24 |
| Syrians | 49.5 /100 | #175 | Average 75.0% |
| Central Americans | 48.7 /100 | #176 | Average 75.0% |
| Immigrants | Mexico | 47.8 /100 | #177 | Average 75.0% |
| Immigrants | Central America | 45.0 /100 | #178 | Average 75.0% |
| Immigrants | Latvia | 44.1 /100 | #179 | Average 75.0% |
| Immigrants | Czechoslovakia | 44.0 /100 | #180 | Average 75.0% |
| Africans | 42.5 /100 | #181 | Average 75.0% |
| Immigrants | South Africa | 36.9 /100 | #182 | Fair 74.9% |
| Immigrants | Costa Rica | 36.7 /100 | #183 | Fair 74.9% |
| Immigrants | Hungary | 35.0 /100 | #184 | Fair 74.9% |
| Sri Lankans | 34.9 /100 | #185 | Fair 74.9% |
| Immigrants | Eastern Europe | 33.8 /100 | #186 | Fair 74.9% |
| Immigrants | Honduras | 33.5 /100 | #187 | Fair 74.9% |
| Hondurans | 32.7 /100 | #188 | Fair 74.8% |
| Immigrants | Northern Europe | 32.6 /100 | #189 | Fair 74.8% |
Demographics Similar to Albanians by In Labor Force | Age 20-24
In terms of in labor force | age 20-24, the demographic groups most similar to Albanians are Immigrants from Uruguay (74.6%, a difference of 0.010%), Arab (74.6%, a difference of 0.010%), Sioux (74.6%, a difference of 0.030%), Uruguayan (74.6%, a difference of 0.030%), and Immigrants from Northern Africa (74.6%, a difference of 0.040%).
| Demographics | Rating | Rank | In Labor Force | Age 20-24 |
| Nigerians | 21.9 /100 | #200 | Fair 74.7% |
| Choctaw | 21.4 /100 | #201 | Fair 74.7% |
| Moroccans | 20.4 /100 | #202 | Fair 74.7% |
| Immigrants | Northern Africa | 17.9 /100 | #203 | Poor 74.6% |
| Immigrants | Italy | 17.6 /100 | #204 | Poor 74.6% |
| Inupiat | 17.6 /100 | #205 | Poor 74.6% |
| Sioux | 17.5 /100 | #206 | Poor 74.6% |
| Albanians | 16.2 /100 | #207 | Poor 74.6% |
| Immigrants | Uruguay | 15.8 /100 | #208 | Poor 74.6% |
| Arabs | 15.8 /100 | #209 | Poor 74.6% |
| Uruguayans | 15.1 /100 | #210 | Poor 74.6% |
| Immigrants | Australia | 14.7 /100 | #211 | Poor 74.6% |
| Creek | 13.3 /100 | #212 | Poor 74.5% |
| Peruvians | 13.3 /100 | #213 | Poor 74.5% |
| Immigrants | Southern Europe | 13.2 /100 | #214 | Poor 74.5% |