Eastern European vs Immigrants from Lebanon In Labor Force | Age 30-34
COMPARE
Eastern European
Immigrants from Lebanon
In Labor Force | Age 30-34
In Labor Force | Age 30-34 Comparison
Eastern Europeans
Immigrants from Lebanon
85.7%
IN LABOR FORCE | AGE 30-34
99.9/ 100
METRIC RATING
39th/ 347
METRIC RANK
83.9%
IN LABOR FORCE | AGE 30-34
0.4/ 100
METRIC RATING
256th/ 347
METRIC RANK
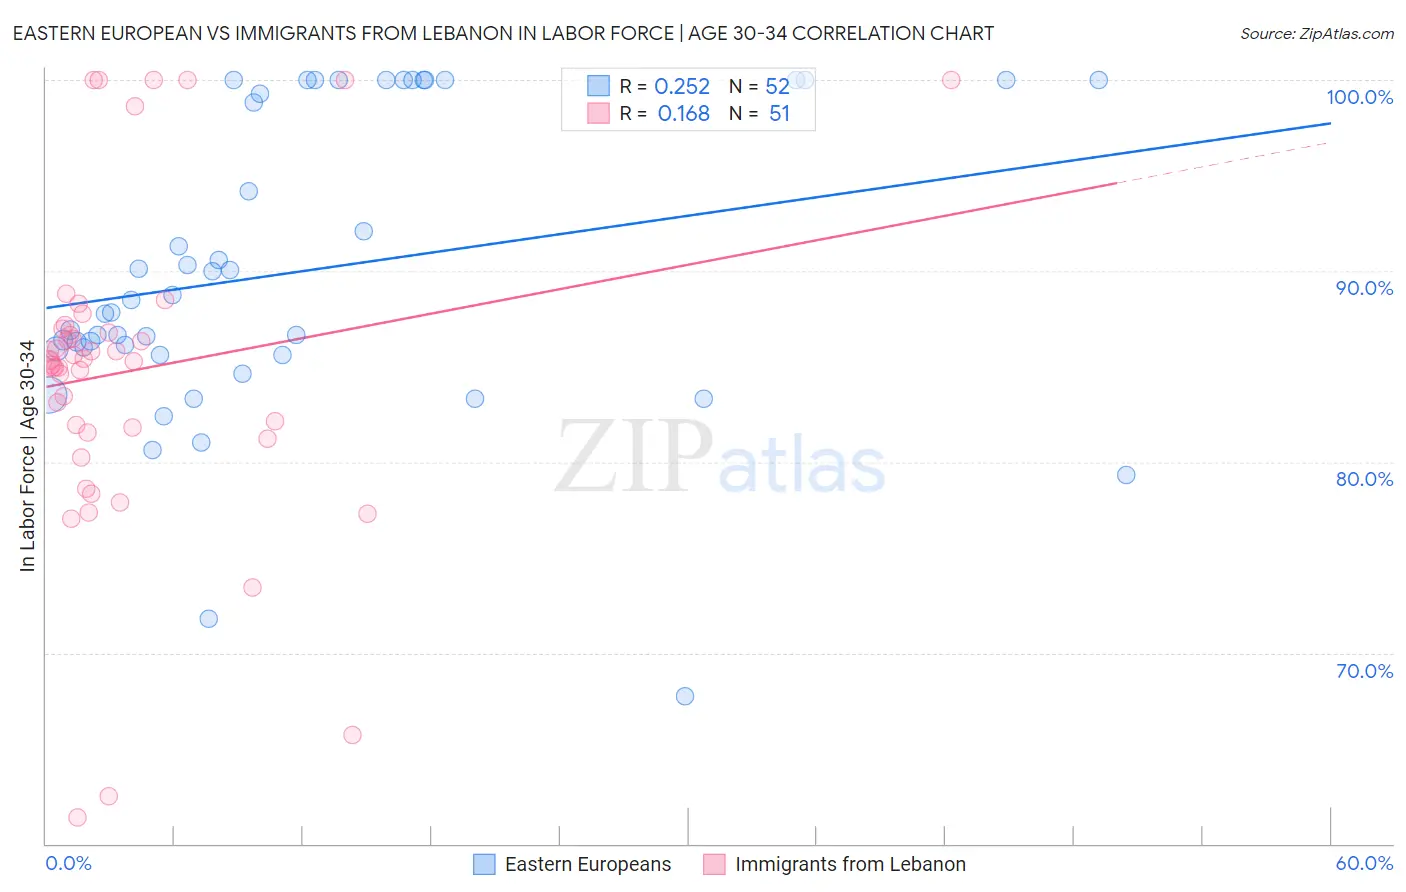
Eastern European vs Immigrants from Lebanon In Labor Force | Age 30-34 Correlation Chart
The statistical analysis conducted on geographies consisting of 460,851,415 people shows a weak positive correlation between the proportion of Eastern Europeans and labor force participation rate among population between the ages 30 and 34 in the United States with a correlation coefficient (R) of 0.252 and weighted average of 85.7%. Similarly, the statistical analysis conducted on geographies consisting of 217,118,980 people shows a poor positive correlation between the proportion of Immigrants from Lebanon and labor force participation rate among population between the ages 30 and 34 in the United States with a correlation coefficient (R) of 0.168 and weighted average of 83.9%, a difference of 2.2%.
In Labor Force | Age 30-34 Correlation Summary
| Measurement | Eastern European | Immigrants from Lebanon |
| Minimum | 67.7% | 61.4% |
| Maximum | 100.0% | 100.0% |
| Range | 32.3% | 38.6% |
| Mean | 90.0% | 84.8% |
| Median | 88.2% | 85.3% |
| Interquartile 25% (IQ1) | 85.8% | 81.5% |
| Interquartile 75% (IQ3) | 100.0% | 87.0% |
| Interquartile Range (IQR) | 14.2% | 5.5% |
| Standard Deviation (Sample) | 7.9% | 8.5% |
| Standard Deviation (Population) | 7.8% | 8.4% |
Similar Demographics by In Labor Force | Age 30-34
Demographics Similar to Eastern Europeans by In Labor Force | Age 30-34
In terms of in labor force | age 30-34, the demographic groups most similar to Eastern Europeans are Immigrants from Greece (85.7%, a difference of 0.030%), Norwegian (85.7%, a difference of 0.040%), Turkish (85.7%, a difference of 0.040%), Serbian (85.8%, a difference of 0.050%), and Albanian (85.7%, a difference of 0.050%).
| Demographics | Rating | Rank | In Labor Force | Age 30-34 |
| Cypriots | 99.9 /100 | #32 | Exceptional 85.8% |
| Immigrants | Bosnia and Herzegovina | 99.9 /100 | #33 | Exceptional 85.8% |
| Ugandans | 99.9 /100 | #34 | Exceptional 85.8% |
| Serbians | 99.9 /100 | #35 | Exceptional 85.8% |
| Albanians | 99.9 /100 | #36 | Exceptional 85.7% |
| Norwegians | 99.9 /100 | #37 | Exceptional 85.7% |
| Immigrants | Greece | 99.9 /100 | #38 | Exceptional 85.7% |
| Eastern Europeans | 99.9 /100 | #39 | Exceptional 85.7% |
| Turks | 99.9 /100 | #40 | Exceptional 85.7% |
| Immigrants | Italy | 99.9 /100 | #41 | Exceptional 85.7% |
| Zimbabweans | 99.8 /100 | #42 | Exceptional 85.6% |
| Immigrants | Lithuania | 99.8 /100 | #43 | Exceptional 85.6% |
| Immigrants | Sri Lanka | 99.8 /100 | #44 | Exceptional 85.6% |
| Immigrants | Nepal | 99.8 /100 | #45 | Exceptional 85.6% |
| Immigrants | Morocco | 99.8 /100 | #46 | Exceptional 85.6% |
Demographics Similar to Immigrants from Lebanon by In Labor Force | Age 30-34
In terms of in labor force | age 30-34, the demographic groups most similar to Immigrants from Lebanon are Iraqi (83.8%, a difference of 0.010%), White/Caucasian (83.9%, a difference of 0.040%), Honduran (83.8%, a difference of 0.040%), Scotch-Irish (83.8%, a difference of 0.050%), and Immigrants from St. Vincent and the Grenadines (83.9%, a difference of 0.060%).
| Demographics | Rating | Rank | In Labor Force | Age 30-34 |
| Immigrants | Dominica | 0.7 /100 | #249 | Tragic 84.0% |
| Immigrants | Iraq | 0.7 /100 | #250 | Tragic 83.9% |
| Nicaraguans | 0.6 /100 | #251 | Tragic 83.9% |
| Bahamians | 0.6 /100 | #252 | Tragic 83.9% |
| Immigrants | Nicaragua | 0.6 /100 | #253 | Tragic 83.9% |
| Immigrants | St. Vincent and the Grenadines | 0.5 /100 | #254 | Tragic 83.9% |
| Whites/Caucasians | 0.5 /100 | #255 | Tragic 83.9% |
| Immigrants | Lebanon | 0.4 /100 | #256 | Tragic 83.9% |
| Iraqis | 0.3 /100 | #257 | Tragic 83.8% |
| Hondurans | 0.3 /100 | #258 | Tragic 83.8% |
| Scotch-Irish | 0.3 /100 | #259 | Tragic 83.8% |
| Immigrants | Dominican Republic | 0.3 /100 | #260 | Tragic 83.8% |
| Guyanese | 0.3 /100 | #261 | Tragic 83.8% |
| Dominicans | 0.2 /100 | #262 | Tragic 83.8% |
| Immigrants | Guyana | 0.2 /100 | #263 | Tragic 83.8% |