Russian vs Immigrants from Lebanon In Labor Force | Age 30-34
COMPARE
Russian
Immigrants from Lebanon
In Labor Force | Age 30-34
In Labor Force | Age 30-34 Comparison
Russians
Immigrants from Lebanon
85.5%
IN LABOR FORCE | AGE 30-34
99.6/ 100
METRIC RATING
57th/ 347
METRIC RANK
83.9%
IN LABOR FORCE | AGE 30-34
0.4/ 100
METRIC RATING
256th/ 347
METRIC RANK
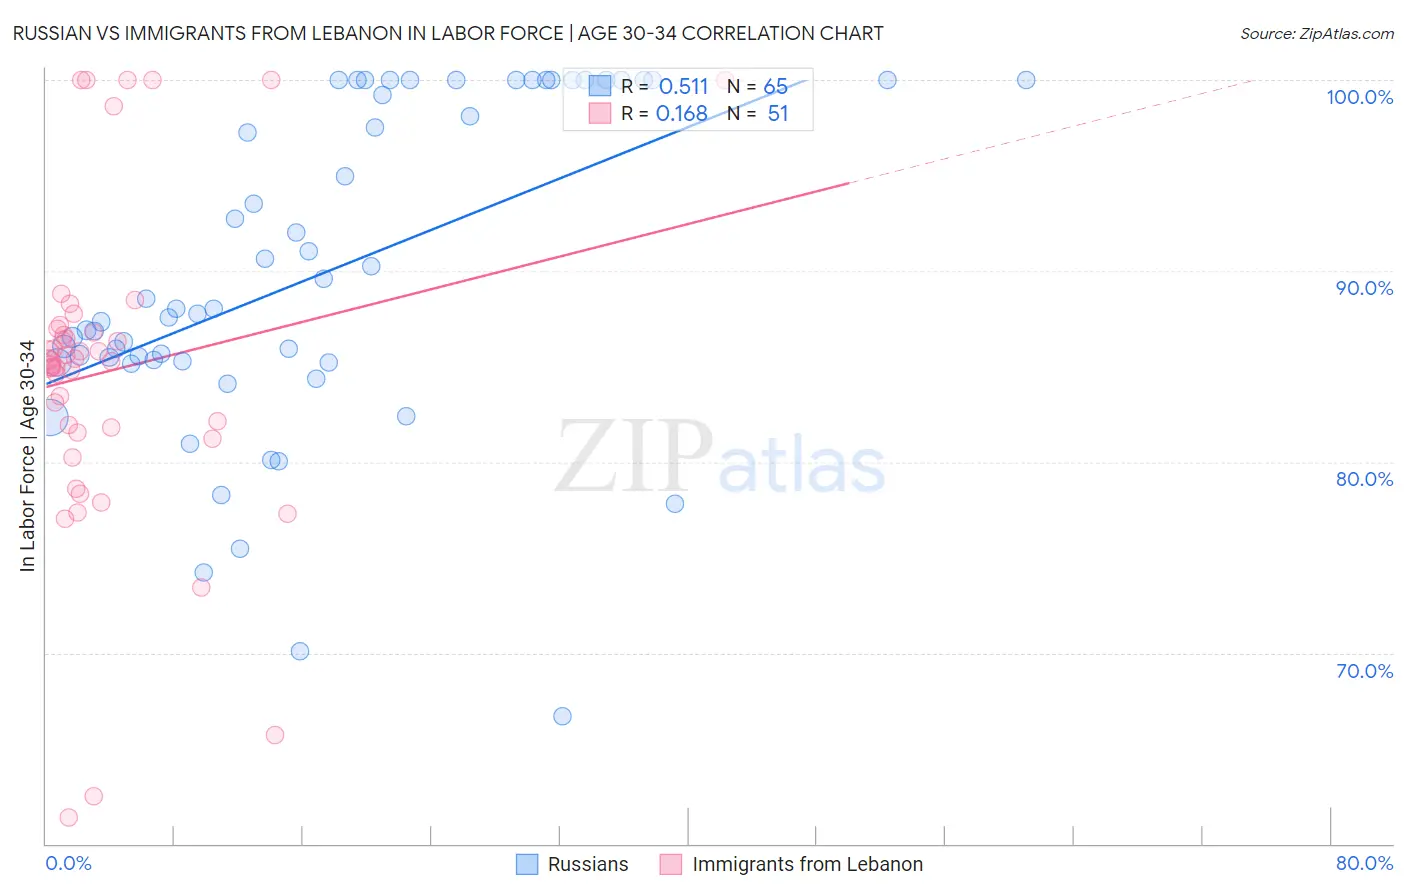
Russian vs Immigrants from Lebanon In Labor Force | Age 30-34 Correlation Chart
The statistical analysis conducted on geographies consisting of 511,538,984 people shows a substantial positive correlation between the proportion of Russians and labor force participation rate among population between the ages 30 and 34 in the United States with a correlation coefficient (R) of 0.511 and weighted average of 85.5%. Similarly, the statistical analysis conducted on geographies consisting of 217,118,980 people shows a poor positive correlation between the proportion of Immigrants from Lebanon and labor force participation rate among population between the ages 30 and 34 in the United States with a correlation coefficient (R) of 0.168 and weighted average of 83.9%, a difference of 2.0%.
In Labor Force | Age 30-34 Correlation Summary
| Measurement | Russian | Immigrants from Lebanon |
| Minimum | 66.7% | 61.4% |
| Maximum | 100.0% | 100.0% |
| Range | 33.3% | 38.6% |
| Mean | 89.9% | 84.8% |
| Median | 88.0% | 85.3% |
| Interquartile 25% (IQ1) | 85.2% | 81.5% |
| Interquartile 75% (IQ3) | 100.0% | 87.0% |
| Interquartile Range (IQR) | 14.8% | 5.5% |
| Standard Deviation (Sample) | 8.5% | 8.5% |
| Standard Deviation (Population) | 8.4% | 8.4% |
Similar Demographics by In Labor Force | Age 30-34
Demographics Similar to Russians by In Labor Force | Age 30-34
In terms of in labor force | age 30-34, the demographic groups most similar to Russians are Czech (85.5%, a difference of 0.0%), Polish (85.5%, a difference of 0.0%), Immigrants from Kenya (85.5%, a difference of 0.010%), Immigrants from Turkey (85.5%, a difference of 0.010%), and Immigrants from Poland (85.5%, a difference of 0.020%).
| Demographics | Rating | Rank | In Labor Force | Age 30-34 |
| Immigrants | Australia | 99.8 /100 | #50 | Exceptional 85.6% |
| Cape Verdeans | 99.7 /100 | #51 | Exceptional 85.6% |
| Slovenes | 99.7 /100 | #52 | Exceptional 85.6% |
| Filipinos | 99.6 /100 | #53 | Exceptional 85.5% |
| Immigrants | Kenya | 99.6 /100 | #54 | Exceptional 85.5% |
| Immigrants | Turkey | 99.6 /100 | #55 | Exceptional 85.5% |
| Czechs | 99.6 /100 | #56 | Exceptional 85.5% |
| Russians | 99.6 /100 | #57 | Exceptional 85.5% |
| Poles | 99.6 /100 | #58 | Exceptional 85.5% |
| Immigrants | Poland | 99.5 /100 | #59 | Exceptional 85.5% |
| Immigrants | France | 99.5 /100 | #60 | Exceptional 85.5% |
| Immigrants | Brazil | 99.5 /100 | #61 | Exceptional 85.5% |
| Soviet Union | 99.4 /100 | #62 | Exceptional 85.5% |
| Macedonians | 99.4 /100 | #63 | Exceptional 85.5% |
| Italians | 99.4 /100 | #64 | Exceptional 85.4% |
Demographics Similar to Immigrants from Lebanon by In Labor Force | Age 30-34
In terms of in labor force | age 30-34, the demographic groups most similar to Immigrants from Lebanon are Iraqi (83.8%, a difference of 0.010%), White/Caucasian (83.9%, a difference of 0.040%), Honduran (83.8%, a difference of 0.040%), Scotch-Irish (83.8%, a difference of 0.050%), and Immigrants from St. Vincent and the Grenadines (83.9%, a difference of 0.060%).
| Demographics | Rating | Rank | In Labor Force | Age 30-34 |
| Immigrants | Dominica | 0.7 /100 | #249 | Tragic 84.0% |
| Immigrants | Iraq | 0.7 /100 | #250 | Tragic 83.9% |
| Nicaraguans | 0.6 /100 | #251 | Tragic 83.9% |
| Bahamians | 0.6 /100 | #252 | Tragic 83.9% |
| Immigrants | Nicaragua | 0.6 /100 | #253 | Tragic 83.9% |
| Immigrants | St. Vincent and the Grenadines | 0.5 /100 | #254 | Tragic 83.9% |
| Whites/Caucasians | 0.5 /100 | #255 | Tragic 83.9% |
| Immigrants | Lebanon | 0.4 /100 | #256 | Tragic 83.9% |
| Iraqis | 0.3 /100 | #257 | Tragic 83.8% |
| Hondurans | 0.3 /100 | #258 | Tragic 83.8% |
| Scotch-Irish | 0.3 /100 | #259 | Tragic 83.8% |
| Immigrants | Dominican Republic | 0.3 /100 | #260 | Tragic 83.8% |
| Guyanese | 0.3 /100 | #261 | Tragic 83.8% |
| Dominicans | 0.2 /100 | #262 | Tragic 83.8% |
| Immigrants | Guyana | 0.2 /100 | #263 | Tragic 83.8% |