Immigrants from Guatemala vs Immigrants from Croatia In Labor Force | Age 30-34
COMPARE
Immigrants from Guatemala
Immigrants from Croatia
In Labor Force | Age 30-34
In Labor Force | Age 30-34 Comparison
Immigrants from Guatemala
Immigrants from Croatia
83.7%
IN LABOR FORCE | AGE 30-34
0.1/ 100
METRIC RATING
266th/ 347
METRIC RANK
86.1%
IN LABOR FORCE | AGE 30-34
100.0/ 100
METRIC RATING
13th/ 347
METRIC RANK
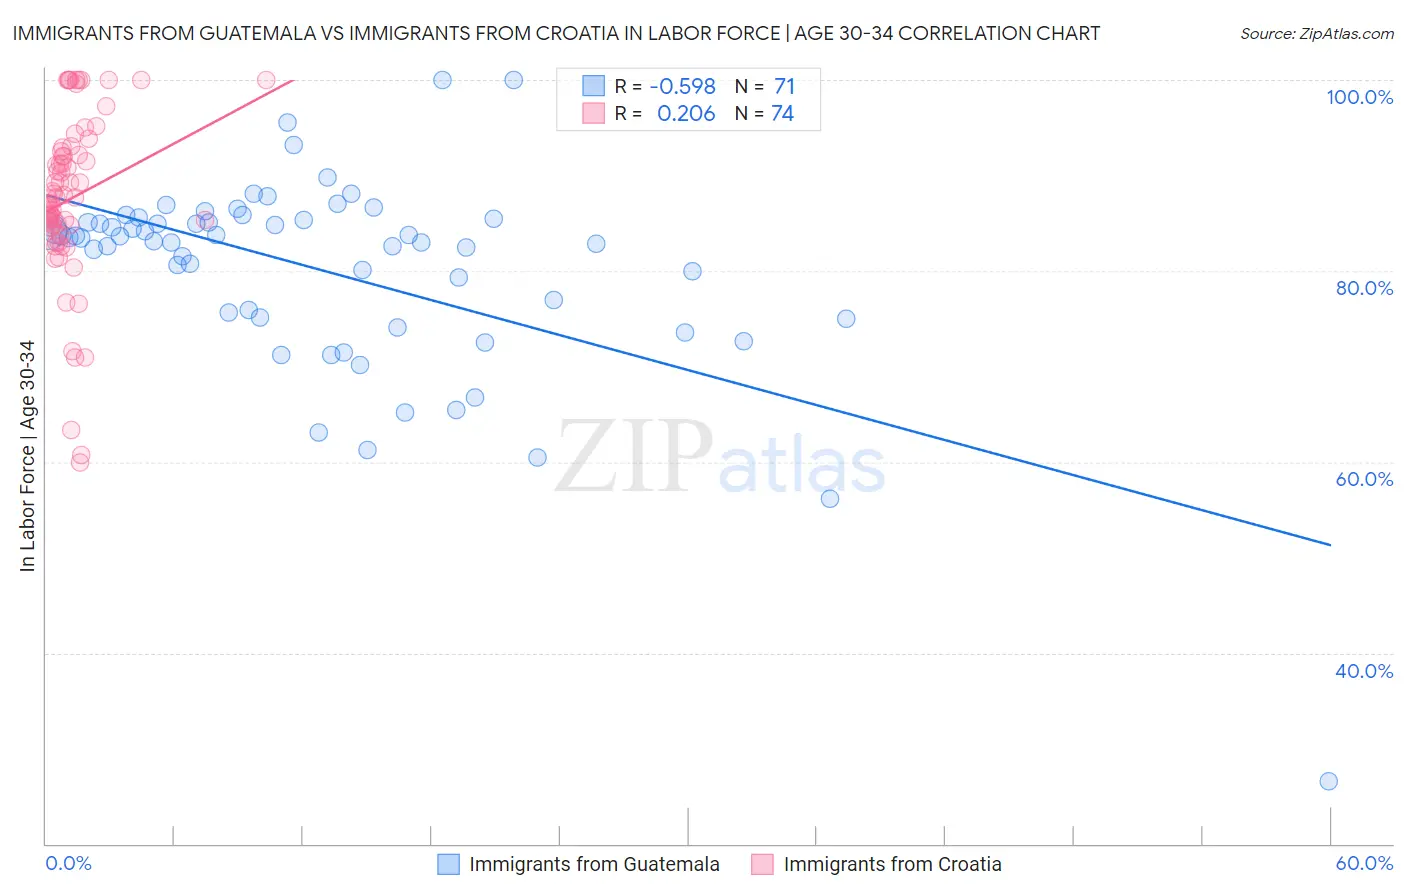
Immigrants from Guatemala vs Immigrants from Croatia In Labor Force | Age 30-34 Correlation Chart
The statistical analysis conducted on geographies consisting of 377,154,484 people shows a substantial negative correlation between the proportion of Immigrants from Guatemala and labor force participation rate among population between the ages 30 and 34 in the United States with a correlation coefficient (R) of -0.598 and weighted average of 83.7%. Similarly, the statistical analysis conducted on geographies consisting of 132,558,234 people shows a weak positive correlation between the proportion of Immigrants from Croatia and labor force participation rate among population between the ages 30 and 34 in the United States with a correlation coefficient (R) of 0.206 and weighted average of 86.1%, a difference of 2.9%.
In Labor Force | Age 30-34 Correlation Summary
| Measurement | Immigrants from Guatemala | Immigrants from Croatia |
| Minimum | 26.6% | 60.0% |
| Maximum | 100.0% | 100.0% |
| Range | 73.4% | 40.0% |
| Mean | 80.1% | 87.6% |
| Median | 83.5% | 87.7% |
| Interquartile 25% (IQ1) | 75.1% | 84.6% |
| Interquartile 75% (IQ3) | 85.3% | 92.6% |
| Interquartile Range (IQR) | 10.2% | 8.0% |
| Standard Deviation (Sample) | 10.6% | 8.8% |
| Standard Deviation (Population) | 10.6% | 8.8% |
Similar Demographics by In Labor Force | Age 30-34
Demographics Similar to Immigrants from Guatemala by In Labor Force | Age 30-34
In terms of in labor force | age 30-34, the demographic groups most similar to Immigrants from Guatemala are Immigrants from Honduras (83.7%, a difference of 0.020%), Guatemalan (83.7%, a difference of 0.050%), Immigrants from Guyana (83.8%, a difference of 0.090%), Dominican (83.8%, a difference of 0.10%), and Spaniard (83.6%, a difference of 0.10%).
| Demographics | Rating | Rank | In Labor Force | Age 30-34 |
| Scotch-Irish | 0.3 /100 | #259 | Tragic 83.8% |
| Immigrants | Dominican Republic | 0.3 /100 | #260 | Tragic 83.8% |
| Guyanese | 0.3 /100 | #261 | Tragic 83.8% |
| Dominicans | 0.2 /100 | #262 | Tragic 83.8% |
| Immigrants | Guyana | 0.2 /100 | #263 | Tragic 83.8% |
| Guatemalans | 0.2 /100 | #264 | Tragic 83.7% |
| Immigrants | Honduras | 0.1 /100 | #265 | Tragic 83.7% |
| Immigrants | Guatemala | 0.1 /100 | #266 | Tragic 83.7% |
| Spaniards | 0.1 /100 | #267 | Tragic 83.6% |
| Immigrants | Bangladesh | 0.1 /100 | #268 | Tragic 83.6% |
| Vietnamese | 0.1 /100 | #269 | Tragic 83.6% |
| Spanish Americans | 0.0 /100 | #270 | Tragic 83.5% |
| Spanish | 0.0 /100 | #271 | Tragic 83.5% |
| Immigrants | Nonimmigrants | 0.0 /100 | #272 | Tragic 83.5% |
| Guamanians/Chamorros | 0.0 /100 | #273 | Tragic 83.5% |
Demographics Similar to Immigrants from Croatia by In Labor Force | Age 30-34
In terms of in labor force | age 30-34, the demographic groups most similar to Immigrants from Croatia are Bolivian (86.1%, a difference of 0.0%), Immigrants from Cabo Verde (86.1%, a difference of 0.010%), Immigrants from Albania (86.1%, a difference of 0.030%), Latvian (86.0%, a difference of 0.060%), and Immigrants from Cameroon (86.0%, a difference of 0.060%).
| Demographics | Rating | Rank | In Labor Force | Age 30-34 |
| Somalis | 100.0 /100 | #6 | Exceptional 86.2% |
| Immigrants | Bolivia | 100.0 /100 | #7 | Exceptional 86.2% |
| Cambodians | 100.0 /100 | #8 | Exceptional 86.2% |
| Immigrants | Somalia | 100.0 /100 | #9 | Exceptional 86.2% |
| Immigrants | Serbia | 100.0 /100 | #10 | Exceptional 86.2% |
| Carpatho Rusyns | 100.0 /100 | #11 | Exceptional 86.2% |
| Bolivians | 100.0 /100 | #12 | Exceptional 86.1% |
| Immigrants | Croatia | 100.0 /100 | #13 | Exceptional 86.1% |
| Immigrants | Cabo Verde | 100.0 /100 | #14 | Exceptional 86.1% |
| Immigrants | Albania | 100.0 /100 | #15 | Exceptional 86.1% |
| Latvians | 100.0 /100 | #16 | Exceptional 86.0% |
| Immigrants | Cameroon | 100.0 /100 | #17 | Exceptional 86.0% |
| Immigrants | Sierra Leone | 100.0 /100 | #18 | Exceptional 86.0% |
| Sierra Leoneans | 100.0 /100 | #19 | Exceptional 86.0% |
| Bulgarians | 100.0 /100 | #20 | Exceptional 86.0% |