Cuban vs Immigrants from Austria In Labor Force | Age 35-44
COMPARE
Cuban
Immigrants from Austria
In Labor Force | Age 35-44
In Labor Force | Age 35-44 Comparison
Cubans
Immigrants from Austria
84.8%
IN LABOR FORCE | AGE 35-44
96.6/ 100
METRIC RATING
96th/ 347
METRIC RANK
84.4%
IN LABOR FORCE | AGE 35-44
63.8/ 100
METRIC RATING
157th/ 347
METRIC RANK
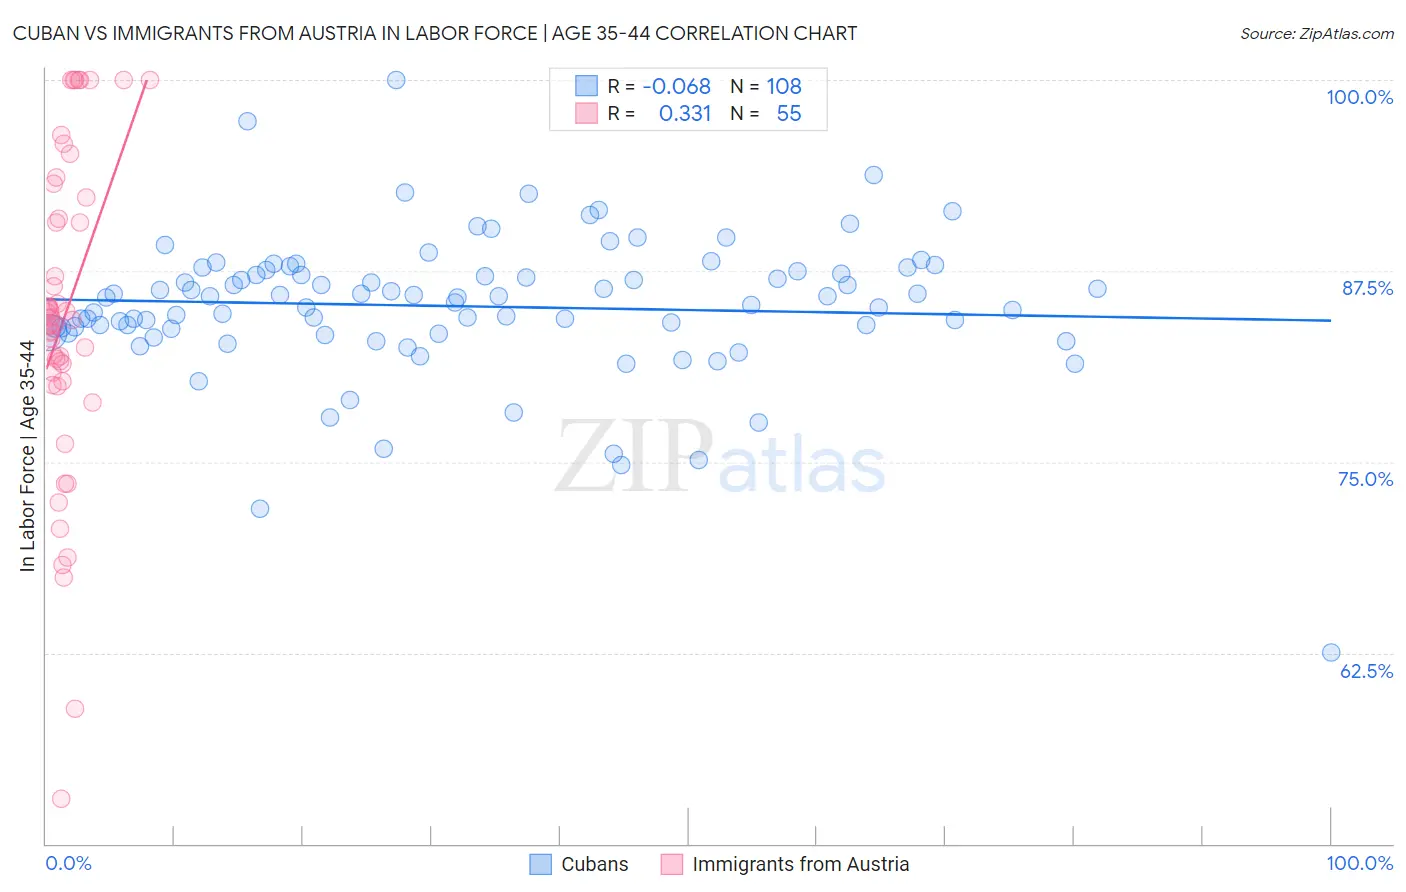
Cuban vs Immigrants from Austria In Labor Force | Age 35-44 Correlation Chart
The statistical analysis conducted on geographies consisting of 449,058,980 people shows a slight negative correlation between the proportion of Cubans and labor force participation rate among population between the ages 35 and 44 in the United States with a correlation coefficient (R) of -0.068 and weighted average of 84.8%. Similarly, the statistical analysis conducted on geographies consisting of 167,953,357 people shows a mild positive correlation between the proportion of Immigrants from Austria and labor force participation rate among population between the ages 35 and 44 in the United States with a correlation coefficient (R) of 0.331 and weighted average of 84.4%, a difference of 0.45%.
In Labor Force | Age 35-44 Correlation Summary
| Measurement | Cuban | Immigrants from Austria |
| Minimum | 62.5% | 52.9% |
| Maximum | 100.0% | 100.0% |
| Range | 37.5% | 47.1% |
| Mean | 85.2% | 84.6% |
| Median | 85.7% | 84.3% |
| Interquartile 25% (IQ1) | 83.6% | 80.3% |
| Interquartile 75% (IQ3) | 87.4% | 92.3% |
| Interquartile Range (IQR) | 3.8% | 12.0% |
| Standard Deviation (Sample) | 4.7% | 10.5% |
| Standard Deviation (Population) | 4.7% | 10.4% |
Similar Demographics by In Labor Force | Age 35-44
Demographics Similar to Cubans by In Labor Force | Age 35-44
In terms of in labor force | age 35-44, the demographic groups most similar to Cubans are Immigrants from Kuwait (84.8%, a difference of 0.0%), Egyptian (84.8%, a difference of 0.0%), Mongolian (84.8%, a difference of 0.010%), Immigrants from Europe (84.9%, a difference of 0.030%), and Ghanaian (84.8%, a difference of 0.030%).
| Demographics | Rating | Rank | In Labor Force | Age 35-44 |
| Immigrants | Pakistan | 97.5 /100 | #89 | Exceptional 84.9% |
| Immigrants | France | 97.4 /100 | #90 | Exceptional 84.9% |
| Immigrants | Europe | 97.2 /100 | #91 | Exceptional 84.9% |
| Ghanaians | 97.2 /100 | #92 | Exceptional 84.8% |
| Immigrants | Northern Africa | 97.1 /100 | #93 | Exceptional 84.8% |
| Mongolians | 96.8 /100 | #94 | Exceptional 84.8% |
| Immigrants | Kuwait | 96.7 /100 | #95 | Exceptional 84.8% |
| Cubans | 96.6 /100 | #96 | Exceptional 84.8% |
| Egyptians | 96.6 /100 | #97 | Exceptional 84.8% |
| Indians (Asian) | 96.1 /100 | #98 | Exceptional 84.8% |
| Haitians | 96.0 /100 | #99 | Exceptional 84.8% |
| Immigrants | Czechoslovakia | 95.9 /100 | #100 | Exceptional 84.8% |
| Immigrants | Australia | 95.5 /100 | #101 | Exceptional 84.8% |
| Immigrants | Southern Europe | 95.3 /100 | #102 | Exceptional 84.8% |
| Immigrants | Belarus | 95.3 /100 | #103 | Exceptional 84.8% |
Demographics Similar to Immigrants from Austria by In Labor Force | Age 35-44
In terms of in labor force | age 35-44, the demographic groups most similar to Immigrants from Austria are Immigrants from Israel (84.4%, a difference of 0.0%), Immigrants from Switzerland (84.5%, a difference of 0.010%), Jamaican (84.4%, a difference of 0.010%), Immigrants from Senegal (84.4%, a difference of 0.020%), and Immigrants from Kazakhstan (84.4%, a difference of 0.020%).
| Demographics | Rating | Rank | In Labor Force | Age 35-44 |
| Immigrants | Nigeria | 73.3 /100 | #150 | Good 84.5% |
| Romanians | 72.1 /100 | #151 | Good 84.5% |
| Immigrants | Taiwan | 71.4 /100 | #152 | Good 84.5% |
| Trinidadians and Tobagonians | 69.5 /100 | #153 | Good 84.5% |
| Iranians | 69.4 /100 | #154 | Good 84.5% |
| Immigrants | Switzerland | 65.9 /100 | #155 | Good 84.5% |
| Immigrants | Israel | 64.3 /100 | #156 | Good 84.4% |
| Immigrants | Austria | 63.8 /100 | #157 | Good 84.4% |
| Jamaicans | 62.7 /100 | #158 | Good 84.4% |
| Immigrants | Senegal | 60.4 /100 | #159 | Good 84.4% |
| Immigrants | Kazakhstan | 60.4 /100 | #160 | Good 84.4% |
| Immigrants | Venezuela | 60.0 /100 | #161 | Good 84.4% |
| Immigrants | Hungary | 59.4 /100 | #162 | Average 84.4% |
| Aleuts | 59.1 /100 | #163 | Average 84.4% |
| Nigerians | 58.9 /100 | #164 | Average 84.4% |