Cuban vs Slovak In Labor Force | Age 45-54
COMPARE
Cuban
Slovak
In Labor Force | Age 45-54
In Labor Force | Age 45-54 Comparison
Cubans
Slovaks
83.4%
IN LABOR FORCE | AGE 45-54
96.7/ 100
METRIC RATING
77th/ 347
METRIC RANK
83.2%
IN LABOR FORCE | AGE 45-54
92.8/ 100
METRIC RATING
108th/ 347
METRIC RANK
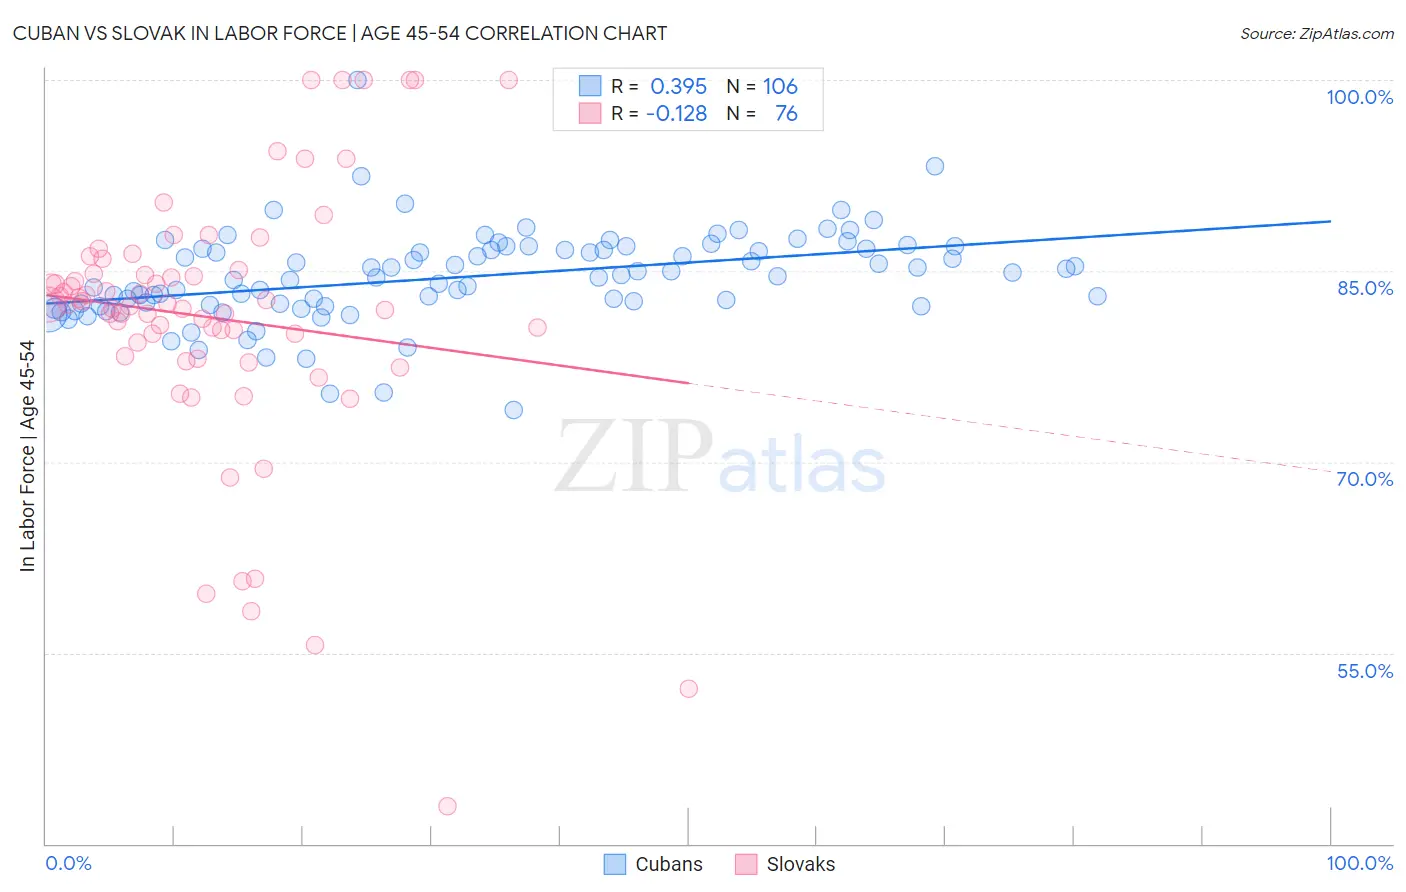
Cuban vs Slovak In Labor Force | Age 45-54 Correlation Chart
The statistical analysis conducted on geographies consisting of 448,959,776 people shows a mild positive correlation between the proportion of Cubans and labor force participation rate among population between the ages 45 and 54 in the United States with a correlation coefficient (R) of 0.395 and weighted average of 83.4%. Similarly, the statistical analysis conducted on geographies consisting of 397,668,603 people shows a poor negative correlation between the proportion of Slovaks and labor force participation rate among population between the ages 45 and 54 in the United States with a correlation coefficient (R) of -0.128 and weighted average of 83.2%, a difference of 0.18%.
In Labor Force | Age 45-54 Correlation Summary
| Measurement | Cuban | Slovak |
| Minimum | 74.0% | 42.9% |
| Maximum | 100.0% | 100.0% |
| Range | 26.0% | 57.1% |
| Mean | 84.5% | 81.3% |
| Median | 84.6% | 82.4% |
| Interquartile 25% (IQ1) | 82.3% | 78.8% |
| Interquartile 75% (IQ3) | 86.7% | 84.9% |
| Interquartile Range (IQR) | 4.4% | 6.1% |
| Standard Deviation (Sample) | 3.6% | 10.6% |
| Standard Deviation (Population) | 3.6% | 10.5% |
Similar Demographics by In Labor Force | Age 45-54
Demographics Similar to Cubans by In Labor Force | Age 45-54
In terms of in labor force | age 45-54, the demographic groups most similar to Cubans are Immigrants from Somalia (83.4%, a difference of 0.010%), Estonian (83.4%, a difference of 0.010%), Russian (83.4%, a difference of 0.010%), Immigrants from Egypt (83.4%, a difference of 0.010%), and Belgian (83.4%, a difference of 0.010%).
| Demographics | Rating | Rank | In Labor Force | Age 45-54 |
| Immigrants | Latvia | 97.4 /100 | #70 | Exceptional 83.4% |
| Colombians | 97.3 /100 | #71 | Exceptional 83.4% |
| Serbians | 97.2 /100 | #72 | Exceptional 83.4% |
| Immigrants | Czechoslovakia | 97.1 /100 | #73 | Exceptional 83.4% |
| Immigrants | Somalia | 96.9 /100 | #74 | Exceptional 83.4% |
| Estonians | 96.9 /100 | #75 | Exceptional 83.4% |
| Russians | 96.8 /100 | #76 | Exceptional 83.4% |
| Cubans | 96.7 /100 | #77 | Exceptional 83.4% |
| Immigrants | Egypt | 96.6 /100 | #78 | Exceptional 83.4% |
| Belgians | 96.5 /100 | #79 | Exceptional 83.4% |
| Immigrants | Croatia | 96.5 /100 | #80 | Exceptional 83.4% |
| Jordanians | 96.4 /100 | #81 | Exceptional 83.4% |
| Immigrants | Eastern Asia | 96.3 /100 | #82 | Exceptional 83.4% |
| Immigrants | Zimbabwe | 96.3 /100 | #83 | Exceptional 83.4% |
| Immigrants | Bosnia and Herzegovina | 96.0 /100 | #84 | Exceptional 83.3% |
Demographics Similar to Slovaks by In Labor Force | Age 45-54
In terms of in labor force | age 45-54, the demographic groups most similar to Slovaks are Iranian (83.2%, a difference of 0.0%), Ukrainian (83.2%, a difference of 0.0%), Immigrants from Africa (83.2%, a difference of 0.0%), Sri Lankan (83.2%, a difference of 0.010%), and Immigrants from Italy (83.2%, a difference of 0.010%).
| Demographics | Rating | Rank | In Labor Force | Age 45-54 |
| Immigrants | Belarus | 94.1 /100 | #101 | Exceptional 83.3% |
| Immigrants | Singapore | 93.9 /100 | #102 | Exceptional 83.3% |
| Albanians | 93.9 /100 | #103 | Exceptional 83.3% |
| Immigrants | Romania | 93.8 /100 | #104 | Exceptional 83.3% |
| Immigrants | South America | 93.5 /100 | #105 | Exceptional 83.2% |
| Sri Lankans | 93.2 /100 | #106 | Exceptional 83.2% |
| Iranians | 92.9 /100 | #107 | Exceptional 83.2% |
| Slovaks | 92.8 /100 | #108 | Exceptional 83.2% |
| Ukrainians | 92.7 /100 | #109 | Exceptional 83.2% |
| Immigrants | Africa | 92.6 /100 | #110 | Exceptional 83.2% |
| Immigrants | Italy | 92.5 /100 | #111 | Exceptional 83.2% |
| Immigrants | Afghanistan | 92.4 /100 | #112 | Exceptional 83.2% |
| Immigrants | Albania | 91.8 /100 | #113 | Exceptional 83.2% |
| Assyrians/Chaldeans/Syriacs | 91.7 /100 | #114 | Exceptional 83.2% |
| Immigrants | Chile | 91.6 /100 | #115 | Exceptional 83.2% |