Cuban vs Immigrants from Ecuador Unemployment Among Ages 60 to 64 years
COMPARE
Cuban
Immigrants from Ecuador
Unemployment Among Ages 60 to 64 years
Unemployment Among Ages 60 to 64 years Comparison
Cubans
Immigrants from Ecuador
4.5%
UNEMPLOYMENT AMONG AGES 60 TO 64 YEARS
100.0/ 100
METRIC RATING
29th/ 347
METRIC RANK
5.8%
UNEMPLOYMENT AMONG AGES 60 TO 64 YEARS
0.0/ 100
METRIC RATING
324th/ 347
METRIC RANK
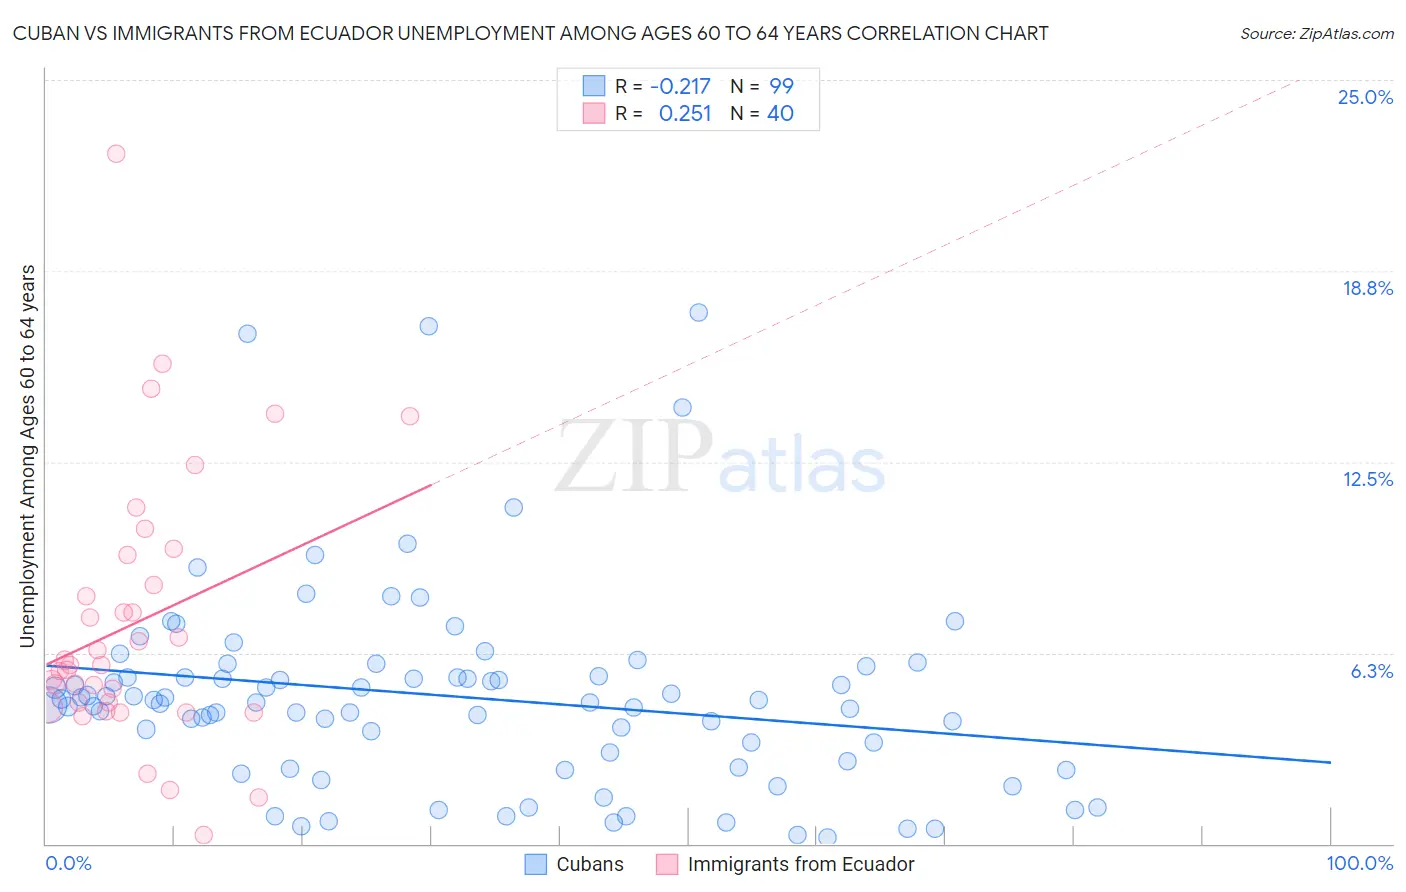
Cuban vs Immigrants from Ecuador Unemployment Among Ages 60 to 64 years Correlation Chart
The statistical analysis conducted on geographies consisting of 400,465,537 people shows a weak negative correlation between the proportion of Cubans and unemployment rate among population between the ages 60 and 64 in the United States with a correlation coefficient (R) of -0.217 and weighted average of 4.5%. Similarly, the statistical analysis conducted on geographies consisting of 255,083,345 people shows a weak positive correlation between the proportion of Immigrants from Ecuador and unemployment rate among population between the ages 60 and 64 in the United States with a correlation coefficient (R) of 0.251 and weighted average of 5.8%, a difference of 30.1%.
Unemployment Among Ages 60 to 64 years Correlation Summary
| Measurement | Cuban | Immigrants from Ecuador |
| Minimum | 0.20% | 0.30% |
| Maximum | 17.4% | 22.6% |
| Range | 17.2% | 22.3% |
| Mean | 4.8% | 7.2% |
| Median | 4.6% | 5.8% |
| Interquartile 25% (IQ1) | 2.7% | 4.5% |
| Interquartile 75% (IQ3) | 5.5% | 9.0% |
| Interquartile Range (IQR) | 2.8% | 4.4% |
| Standard Deviation (Sample) | 3.3% | 4.4% |
| Standard Deviation (Population) | 3.3% | 4.3% |
Similar Demographics by Unemployment Among Ages 60 to 64 years
Demographics Similar to Cubans by Unemployment Among Ages 60 to 64 years
In terms of unemployment among ages 60 to 64 years, the demographic groups most similar to Cubans are Immigrants from Venezuela (4.5%, a difference of 0.020%), Immigrants from Eritrea (4.5%, a difference of 0.090%), Zimbabwean (4.5%, a difference of 0.13%), Carpatho Rusyn (4.5%, a difference of 0.18%), and Immigrants from Nepal (4.5%, a difference of 0.23%).
| Demographics | Rating | Rank | Unemployment Among Ages 60 to 64 years |
| Cape Verdeans | 100.0 /100 | #22 | Exceptional 4.4% |
| Immigrants | Zaire | 100.0 /100 | #23 | Exceptional 4.4% |
| Immigrants | Burma/Myanmar | 100.0 /100 | #24 | Exceptional 4.4% |
| Yugoslavians | 100.0 /100 | #25 | Exceptional 4.4% |
| Czechs | 100.0 /100 | #26 | Exceptional 4.4% |
| Immigrants | Iraq | 100.0 /100 | #27 | Exceptional 4.5% |
| Immigrants | Nepal | 100.0 /100 | #28 | Exceptional 4.5% |
| Cubans | 100.0 /100 | #29 | Exceptional 4.5% |
| Immigrants | Venezuela | 100.0 /100 | #30 | Exceptional 4.5% |
| Immigrants | Eritrea | 100.0 /100 | #31 | Exceptional 4.5% |
| Zimbabweans | 100.0 /100 | #32 | Exceptional 4.5% |
| Carpatho Rusyns | 100.0 /100 | #33 | Exceptional 4.5% |
| Belgians | 100.0 /100 | #34 | Exceptional 4.5% |
| Germans | 100.0 /100 | #35 | Exceptional 4.5% |
| Venezuelans | 100.0 /100 | #36 | Exceptional 4.5% |
Demographics Similar to Immigrants from Ecuador by Unemployment Among Ages 60 to 64 years
In terms of unemployment among ages 60 to 64 years, the demographic groups most similar to Immigrants from Ecuador are Paiute (5.8%, a difference of 0.010%), Alsatian (5.8%, a difference of 0.35%), Immigrants from St. Vincent and the Grenadines (5.9%, a difference of 0.95%), Ecuadorian (5.8%, a difference of 0.96%), and Immigrants from Grenada (5.9%, a difference of 1.0%).
| Demographics | Rating | Rank | Unemployment Among Ages 60 to 64 years |
| Shoshone | 0.0 /100 | #317 | Tragic 5.7% |
| Natives/Alaskans | 0.0 /100 | #318 | Tragic 5.7% |
| Immigrants | Belize | 0.0 /100 | #319 | Tragic 5.7% |
| Colville | 0.0 /100 | #320 | Tragic 5.7% |
| Dutch West Indians | 0.0 /100 | #321 | Tragic 5.7% |
| Ecuadorians | 0.0 /100 | #322 | Tragic 5.8% |
| Alsatians | 0.0 /100 | #323 | Tragic 5.8% |
| Immigrants | Ecuador | 0.0 /100 | #324 | Tragic 5.8% |
| Paiute | 0.0 /100 | #325 | Tragic 5.8% |
| Immigrants | St. Vincent and the Grenadines | 0.0 /100 | #326 | Tragic 5.9% |
| Immigrants | Grenada | 0.0 /100 | #327 | Tragic 5.9% |
| Apache | 0.0 /100 | #328 | Tragic 6.0% |
| Immigrants | Bangladesh | 0.0 /100 | #329 | Tragic 6.0% |
| Immigrants | Armenia | 0.0 /100 | #330 | Tragic 6.0% |
| Yakama | 0.0 /100 | #331 | Tragic 6.0% |