Cuban vs Belizean 5th Grade
COMPARE
Cuban
Belizean
5th Grade
5th Grade Comparison
Cubans
Belizeans
96.6%
5TH GRADE
0.1/ 100
METRIC RATING
276th/ 347
METRIC RANK
95.8%
5TH GRADE
0.0/ 100
METRIC RATING
317th/ 347
METRIC RANK
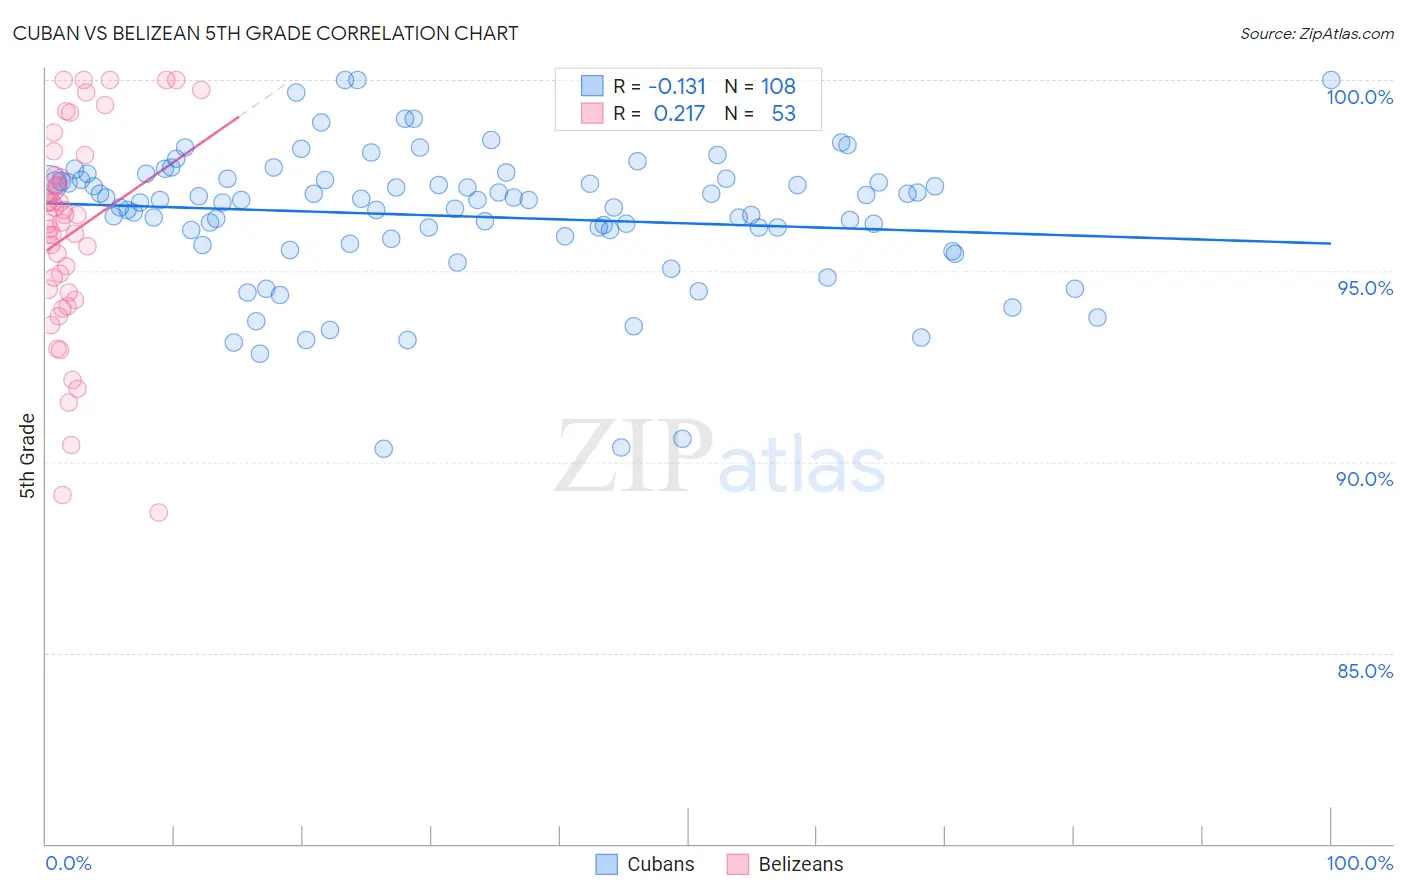
Cuban vs Belizean 5th Grade Correlation Chart
The statistical analysis conducted on geographies consisting of 449,326,865 people shows a poor negative correlation between the proportion of Cubans and percentage of population with at least 5th grade education in the United States with a correlation coefficient (R) of -0.131 and weighted average of 96.6%. Similarly, the statistical analysis conducted on geographies consisting of 144,224,236 people shows a weak positive correlation between the proportion of Belizeans and percentage of population with at least 5th grade education in the United States with a correlation coefficient (R) of 0.217 and weighted average of 95.8%, a difference of 0.89%.
5th Grade Correlation Summary
| Measurement | Cuban | Belizean |
| Minimum | 90.4% | 88.7% |
| Maximum | 100.0% | 100.0% |
| Range | 9.6% | 11.3% |
| Mean | 96.4% | 96.0% |
| Median | 96.9% | 96.3% |
| Interquartile 25% (IQ1) | 95.9% | 94.3% |
| Interquartile 75% (IQ3) | 97.4% | 97.8% |
| Interquartile Range (IQR) | 1.5% | 3.4% |
| Standard Deviation (Sample) | 1.8% | 2.8% |
| Standard Deviation (Population) | 1.8% | 2.7% |
Similar Demographics by 5th Grade
Demographics Similar to Cubans by 5th Grade
In terms of 5th grade, the demographic groups most similar to Cubans are Immigrants from Peru (96.6%, a difference of 0.0%), Immigrants from Bolivia (96.6%, a difference of 0.0%), Yaqui (96.7%, a difference of 0.010%), Immigrants from Cameroon (96.7%, a difference of 0.010%), and Immigrants from Ghana (96.6%, a difference of 0.010%).
| Demographics | Rating | Rank | 5th Grade |
| Ghanaians | 0.2 /100 | #269 | Tragic 96.7% |
| Afghans | 0.2 /100 | #270 | Tragic 96.7% |
| Immigrants | Hong Kong | 0.2 /100 | #271 | Tragic 96.7% |
| Trinidadians and Tobagonians | 0.1 /100 | #272 | Tragic 96.7% |
| Yaqui | 0.1 /100 | #273 | Tragic 96.7% |
| Immigrants | Cameroon | 0.1 /100 | #274 | Tragic 96.7% |
| Immigrants | Peru | 0.1 /100 | #275 | Tragic 96.6% |
| Cubans | 0.1 /100 | #276 | Tragic 96.6% |
| Immigrants | Bolivia | 0.1 /100 | #277 | Tragic 96.6% |
| Immigrants | Ghana | 0.1 /100 | #278 | Tragic 96.6% |
| Immigrants | Philippines | 0.1 /100 | #279 | Tragic 96.6% |
| Immigrants | Western Africa | 0.1 /100 | #280 | Tragic 96.6% |
| Houma | 0.1 /100 | #281 | Tragic 96.6% |
| Barbadians | 0.1 /100 | #282 | Tragic 96.6% |
| Fijians | 0.1 /100 | #283 | Tragic 96.6% |
Demographics Similar to Belizeans by 5th Grade
In terms of 5th grade, the demographic groups most similar to Belizeans are Immigrants from Ecuador (95.8%, a difference of 0.030%), Immigrants from Vietnam (95.8%, a difference of 0.030%), Japanese (95.7%, a difference of 0.070%), Central American Indian (95.7%, a difference of 0.070%), and Nicaraguan (95.9%, a difference of 0.090%).
| Demographics | Rating | Rank | 5th Grade |
| Indonesians | 0.0 /100 | #310 | Tragic 96.0% |
| Immigrants | Bangladesh | 0.0 /100 | #311 | Tragic 96.0% |
| Vietnamese | 0.0 /100 | #312 | Tragic 95.9% |
| Bangladeshis | 0.0 /100 | #313 | Tragic 95.9% |
| Immigrants | Portugal | 0.0 /100 | #314 | Tragic 95.9% |
| Nicaraguans | 0.0 /100 | #315 | Tragic 95.9% |
| Immigrants | Ecuador | 0.0 /100 | #316 | Tragic 95.8% |
| Belizeans | 0.0 /100 | #317 | Tragic 95.8% |
| Immigrants | Vietnam | 0.0 /100 | #318 | Tragic 95.8% |
| Japanese | 0.0 /100 | #319 | Tragic 95.7% |
| Central American Indians | 0.0 /100 | #320 | Tragic 95.7% |
| Immigrants | Belize | 0.0 /100 | #321 | Tragic 95.7% |
| Immigrants | Nicaragua | 0.0 /100 | #322 | Tragic 95.6% |
| Immigrants | Fiji | 0.0 /100 | #323 | Tragic 95.6% |
| Hondurans | 0.0 /100 | #324 | Tragic 95.6% |