Immigrants from Cambodia vs Immigrants from Africa In Labor Force | Age 25-29

COMPARE

Immigrants from Cambodia
Race
Ancestry
AfghanAfricanAlaska NativeAlaskan AthabascanAlbanianAleutAlsatianAmericanApacheArabArapahoArgentineanArmenianAssyrian/Chaldean/SyriacAustralianAustrianBahamianBangladeshiBarbadianBasqueBelgianBelizeanBermudanBhutaneseBlackfeetBolivianBrazilianBritishBritish West IndianBulgarianBurmeseCajunCambodianCanadianCape VerdeanCarpatho RusynCelticCentral AmericanCentral American IndianCherokeeCheyenneChickasawChileanChineseChippewaChoctawColombianColvilleComancheCosta RicanCreeCreekCroatianCrowCubanCypriotCzechCzechoslovakianDanishDelawareDominicanDutchDutch West IndianEastern EuropeanEcuadorianEgyptianEnglishEstonianEthiopianEuropeanFijianFilipinoFinnishFrenchFrench American IndianFrench CanadianGermanGerman RussianGhanaianGreekGuamanian/ChamorroGuatemalanGuyaneseHaitianHmongHonduranHopiHoumaHungarianIcelanderIndian (Asian)IndonesianInupiatIranianIraqiIrishIroquoisIsraeliItalianJamaicanJapaneseJordanianKenyanKiowaKoreanLaotianLatvianLebaneseLiberianLithuanianLumbeeLuxembourgerMacedonianMalaysianMalteseMarshalleseMenomineeMexicanMexican American IndianMongolianMoroccanNative HawaiianNavajoNepaleseNew ZealanderNicaraguanNigerianNorthern EuropeanNorwegianOkinawanOsageOttawaPaiutePakistaniPalestinianPanamanianParaguayanPennsylvania GermanPeruvianPimaPolishPortuguesePotawatomiPuebloPuerto RicanPuget Sound SalishRomanianRussianSalvadoranSamoanScandinavianScotch-IrishScottishSeminoleSenegaleseSerbianShoshoneSierra LeoneanSiouxSlavicSlovakSloveneSomaliSouth AfricanSouth AmericanSouth American IndianSoviet UnionSpaniardSpanishSpanish AmericanSpanish American IndianSri LankanSubsaharan AfricanSudaneseSwedishSwissSyrianTaiwaneseThaiTlingit-HaidaTohono O'OdhamTonganTrinidadian and TobagonianTsimshianTurkishU.S. Virgin IslanderUgandanUkrainianUruguayanUteVenezuelanVietnameseWelshWest IndianYakamaYaquiYugoslavianYumanYup'ikZimbabwean
Immigration
NonimmigrantsImmigrantsAfghanistanAlbaniaArgentinaArmeniaAsiaAustraliaAustriaBahamasBangladeshBarbadosBelarusBelgiumBelizeBoliviaBosnia and HerzegovinaBrazilBulgariaBurma/MyanmarCabo VerdeCambodiaCameroonCanadaCaribbeanCentral AmericaChileChinaColombiaCongoCosta RicaCroatiaCubaCzechoslovakiaDenmarkDominicaDominican RepublicEastern AfricaEastern AsiaEastern EuropeEcuadorEgyptEl SalvadorEnglandEritreaEthiopiaEuropeFijiFranceGermanyGhanaGreeceGrenadaGuatemalaGuyanaHaitiHondurasHong KongHungaryIndiaIndonesiaIranIraqIrelandIsraelItalyJamaicaJapanJordanKazakhstanKenyaKoreaKuwaitLaosLatin AmericaLatviaLebanonLiberiaLithuaniaMalaysiaMexicoMicronesiaMiddle AfricaMoldovaMoroccoNepalNetherlandsNicaraguaNigeriaNorth AmericaNorth MacedoniaNorthern AfricaNorthern EuropeNorwayOceaniaPakistanPanamaPeruPhilippinesPolandPortugalRomaniaRussiaSaudi ArabiaScotlandSenegalSerbiaSierra LeoneSingaporeSomaliaSouth AfricaSouth AmericaSouth Central AsiaSouth Eastern AsiaSouthern EuropeSpainSri LankaSt. Vincent and the GrenadinesSudanSwedenSwitzerlandSyriaTaiwanThailandTrinidad and TobagoTurkeyUgandaUkraineUruguayUzbekistanVenezuelaVietnamWest IndiesWestern AfricaWestern AsiaWestern EuropeYemenZaireZimbabweAzores
Immigrants from Africa
Race
Ancestry
AfghanAfricanAlaska NativeAlaskan AthabascanAlbanianAleutAlsatianAmericanApacheArabArapahoArgentineanArmenianAssyrian/Chaldean/SyriacAustralianAustrianBahamianBangladeshiBarbadianBasqueBelgianBelizeanBermudanBhutaneseBlackfeetBolivianBrazilianBritishBritish West IndianBulgarianBurmeseCajunCambodianCanadianCape VerdeanCarpatho RusynCelticCentral AmericanCentral American IndianCherokeeCheyenneChickasawChileanChineseChippewaChoctawColombianColvilleComancheCosta RicanCreeCreekCroatianCrowCubanCypriotCzechCzechoslovakianDanishDelawareDominicanDutchDutch West IndianEastern EuropeanEcuadorianEgyptianEnglishEstonianEthiopianEuropeanFijianFilipinoFinnishFrenchFrench American IndianFrench CanadianGermanGerman RussianGhanaianGreekGuamanian/ChamorroGuatemalanGuyaneseHaitianHmongHonduranHopiHoumaHungarianIcelanderIndian (Asian)IndonesianInupiatIranianIraqiIrishIroquoisIsraeliItalianJamaicanJapaneseJordanianKenyanKiowaKoreanLaotianLatvianLebaneseLiberianLithuanianLumbeeLuxembourgerMacedonianMalaysianMalteseMarshalleseMenomineeMexicanMexican American IndianMongolianMoroccanNative HawaiianNavajoNepaleseNew ZealanderNicaraguanNigerianNorthern EuropeanNorwegianOkinawanOsageOttawaPaiutePakistaniPalestinianPanamanianParaguayanPennsylvania GermanPeruvianPimaPolishPortuguesePotawatomiPuebloPuerto RicanPuget Sound SalishRomanianRussianSalvadoranSamoanScandinavianScotch-IrishScottishSeminoleSenegaleseSerbianShoshoneSierra LeoneanSiouxSlavicSlovakSloveneSomaliSouth AfricanSouth AmericanSouth American IndianSoviet UnionSpaniardSpanishSpanish AmericanSpanish American IndianSri LankanSubsaharan AfricanSudaneseSwedishSwissSyrianTaiwaneseThaiTlingit-HaidaTohono O'OdhamTonganTrinidadian and TobagonianTsimshianTurkishU.S. Virgin IslanderUgandanUkrainianUruguayanUteVenezuelanVietnameseWelshWest IndianYakamaYaquiYugoslavianYumanYup'ikZimbabwean
Immigration
NonimmigrantsImmigrantsAfghanistanAfricaAlbaniaArgentinaArmeniaAsiaAustraliaAustriaBahamasBangladeshBarbadosBelarusBelgiumBelizeBoliviaBosnia and HerzegovinaBrazilBulgariaBurma/MyanmarCabo VerdeCameroonCanadaCaribbeanCentral AmericaChileChinaColombiaCongoCosta RicaCroatiaCubaCzechoslovakiaDenmarkDominicaDominican RepublicEastern AfricaEastern AsiaEastern EuropeEcuadorEgyptEl SalvadorEnglandEritreaEthiopiaEuropeFijiFranceGermanyGhanaGreeceGrenadaGuatemalaGuyanaHaitiHondurasHong KongHungaryIndiaIndonesiaIranIraqIrelandIsraelItalyJamaicaJapanJordanKazakhstanKenyaKoreaKuwaitLaosLatin AmericaLatviaLebanonLiberiaLithuaniaMalaysiaMexicoMicronesiaMiddle AfricaMoldovaMoroccoNepalNetherlandsNicaraguaNigeriaNorth AmericaNorth MacedoniaNorthern AfricaNorthern EuropeNorwayOceaniaPakistanPanamaPeruPhilippinesPolandPortugalRomaniaRussiaSaudi ArabiaScotlandSenegalSerbiaSierra LeoneSingaporeSomaliaSouth AfricaSouth AmericaSouth Central AsiaSouth Eastern AsiaSouthern EuropeSpainSri LankaSt. Vincent and the GrenadinesSudanSwedenSwitzerlandSyriaTaiwanThailandTrinidad and TobagoTurkeyUgandaUkraineUruguayUzbekistanVenezuelaVietnamWest IndiesWestern AfricaWestern AsiaWestern EuropeYemenZaireZimbabweAzores
In Labor Force | Age 25-29
Income
Poverty
Unemployment
Labor Participation
Family Structure
Vehicle Availability
Education Level
Disability

In Labor Force | Age 25-29 Comparison

Immigrants from Cambodia

Immigrants from Africa

Poor
Exceptional
84.4%
IN LABOR FORCE | AGE 25-29
14.3/ 100
METRIC RATING
206th/ 347
METRIC RANK
85.2%
IN LABOR FORCE | AGE 25-29
96.7/ 100
METRIC RATING
85th/ 347
METRIC RANK

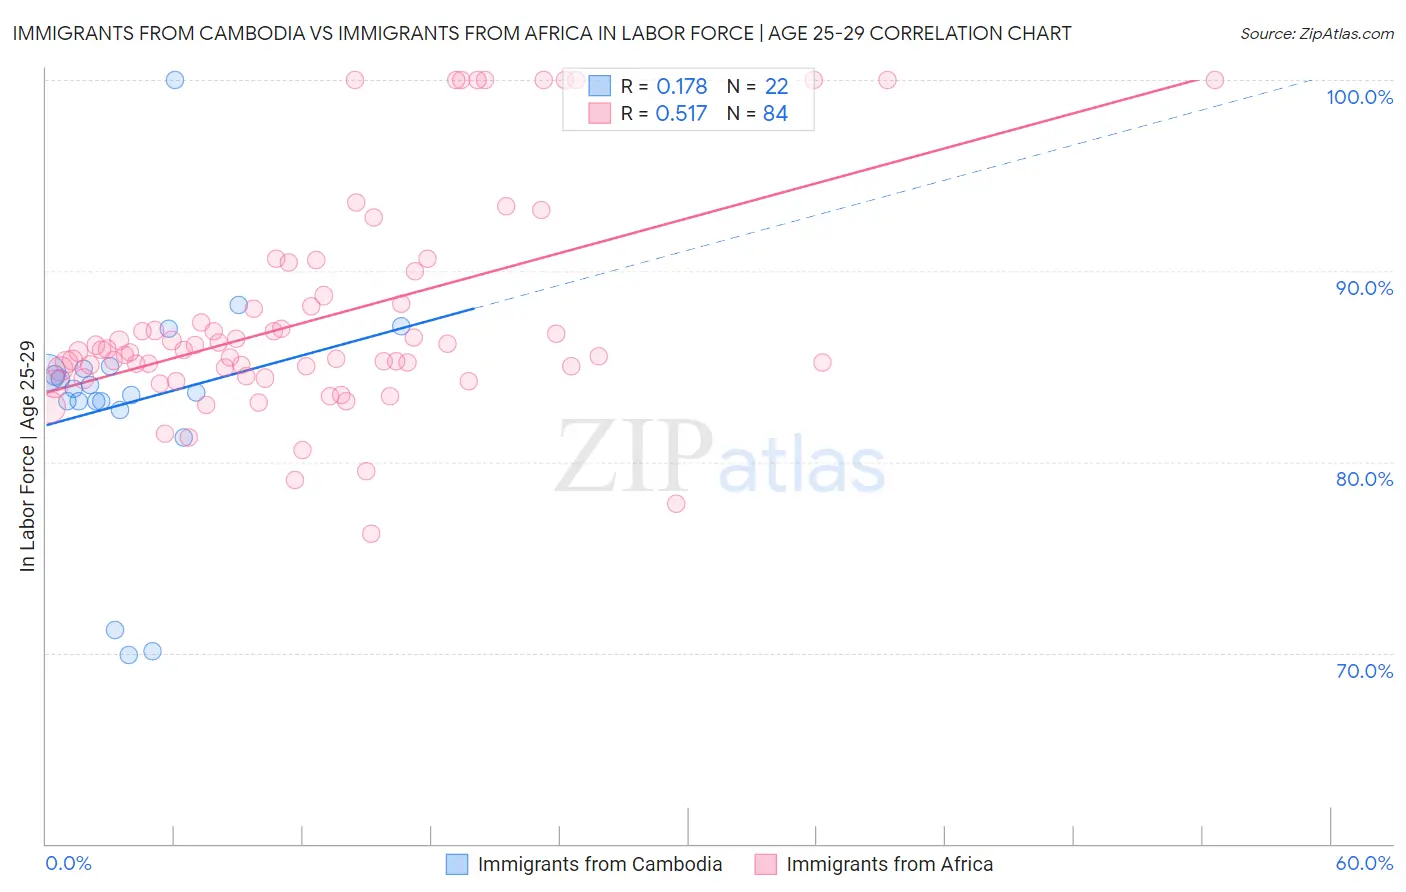
Immigrants from Cambodia vs Immigrants from Africa In Labor Force | Age 25-29 Correlation Chart

The statistical analysis conducted on geographies consisting of 205,138,607 people shows a poor positive correlation between the proportion of Immigrants from Cambodia and labor force participation rate among population between the ages 25 and 29 in the United States with a correlation coefficient (R) of 0.178 and weighted average of 84.4%. Similarly, the statistical analysis conducted on geographies consisting of 469,196,939 people shows a substantial positive correlation between the proportion of Immigrants from Africa and labor force participation rate among population between the ages 25 and 29 in the United States with a correlation coefficient (R) of 0.517 and weighted average of 85.2%, a difference of 0.96%.
Immigrants from Cambodia vs Immigrants from Africa In Labor Force | Age 25-29

In Labor Force | Age 25-29 Correlation Summary

MeasurementImmigrants from CambodiaImmigrants from Africa
Minimum69.9%76.2%
Maximum100.0%100.0%
Range30.1%23.8%
Mean83.1%87.5%
Median83.8%85.8%
Interquartile 25% (IQ1)83.2%84.7%
Interquartile 75% (IQ3)84.9%88.5%
Interquartile Range (IQR)1.7%3.8%
Standard Deviation (Sample)6.3%5.7%
Standard Deviation (Population)6.2%5.7%

Similar Demographics by In Labor Force | Age 25-29

Demographics Similar to Immigrants from Cambodia by In Labor Force | Age 25-29

In terms of in labor force | age 25-29, the demographic groups most similar to Immigrants from Cambodia are Venezuelan (84.4%, a difference of 0.010%), Ecuadorian (84.4%, a difference of 0.010%), Afghan (84.4%, a difference of 0.020%), Immigrants from Afghanistan (84.4%, a difference of 0.020%), and Immigrants from Armenia (84.4%, a difference of 0.020%).
DemographicsRating | RankIn Labor Force | Age 25-29
Immigrants | Germany
18.3
/100
|
#199
Poor
84.4%
Immigrants | Kazakhstan
17.5
/100
|
#200
Poor
84.4%
Laotians
16.6
/100
|
#201
Poor
84.4%
Afghans
15.9
/100
|
#202
Poor
84.4%
Immigrants | Afghanistan
15.6
/100
|
#203
Poor
84.4%
Venezuelans
15.1
/100
|
#204
Poor
84.4%
Ecuadorians
14.8
/100
|
#205
Poor
84.4%
Immigrants | Cambodia
14.3
/100
|
#206
Poor
84.4%
Immigrants | Armenia
13.3
/100
|
#207
Poor
84.4%
Immigrants | Indonesia
13.2
/100
|
#208
Poor
84.4%
Immigrants | Jordan
12.8
/100
|
#209
Poor
84.4%
Chinese
12.7
/100
|
#210
Poor
84.3%
Immigrants | Venezuela
12.6
/100
|
#211
Poor
84.3%
Sub-Saharan Africans
11.7
/100
|
#212
Poor
84.3%
Japanese
11.4
/100
|
#213
Poor
84.3%

Demographics Similar to Immigrants from Africa by In Labor Force | Age 25-29

In terms of in labor force | age 25-29, the demographic groups most similar to Immigrants from Africa are Immigrants from Eastern Europe (85.2%, a difference of 0.0%), Ukrainian (85.2%, a difference of 0.0%), Okinawan (85.2%, a difference of 0.010%), Immigrants from Europe (85.2%, a difference of 0.010%), and French Canadian (85.2%, a difference of 0.010%).
DemographicsRating | RankIn Labor Force | Age 25-29
Immigrants | Egypt
97.7
/100
|
#78
Exceptional
85.2%
Immigrants | Northern Africa
97.6
/100
|
#79
Exceptional
85.2%
Immigrants | Zimbabwe
97.6
/100
|
#80
Exceptional
85.2%
Immigrants | Northern Europe
97.2
/100
|
#81
Exceptional
85.2%
Okinawans
97.0
/100
|
#82
Exceptional
85.2%
Immigrants | Europe
96.8
/100
|
#83
Exceptional
85.2%
Immigrants | Eastern Europe
96.8
/100
|
#84
Exceptional
85.2%
Immigrants | Africa
96.7
/100
|
#85
Exceptional
85.2%
Ukrainians
96.7
/100
|
#86
Exceptional
85.2%
French Canadians
96.5
/100
|
#87
Exceptional
85.2%
Immigrants | Croatia
96.4
/100
|
#88
Exceptional
85.2%
Immigrants | France
96.3
/100
|
#89
Exceptional
85.2%
Burmese
95.9
/100
|
#90
Exceptional
85.1%
Immigrants | Moldova
95.8
/100
|
#91
Exceptional
85.1%
Immigrants | Costa Rica
95.5
/100
|
#92
Exceptional
85.1%