British West Indian vs Menominee In Labor Force | Age 25-29
COMPARE
British West Indian
Menominee
In Labor Force | Age 25-29
In Labor Force | Age 25-29 Comparison
British West Indians
Menominee
83.2%
IN LABOR FORCE | AGE 25-29
0.0/ 100
METRIC RATING
279th/ 347
METRIC RANK
85.4%
IN LABOR FORCE | AGE 25-29
99.1/ 100
METRIC RATING
69th/ 347
METRIC RANK
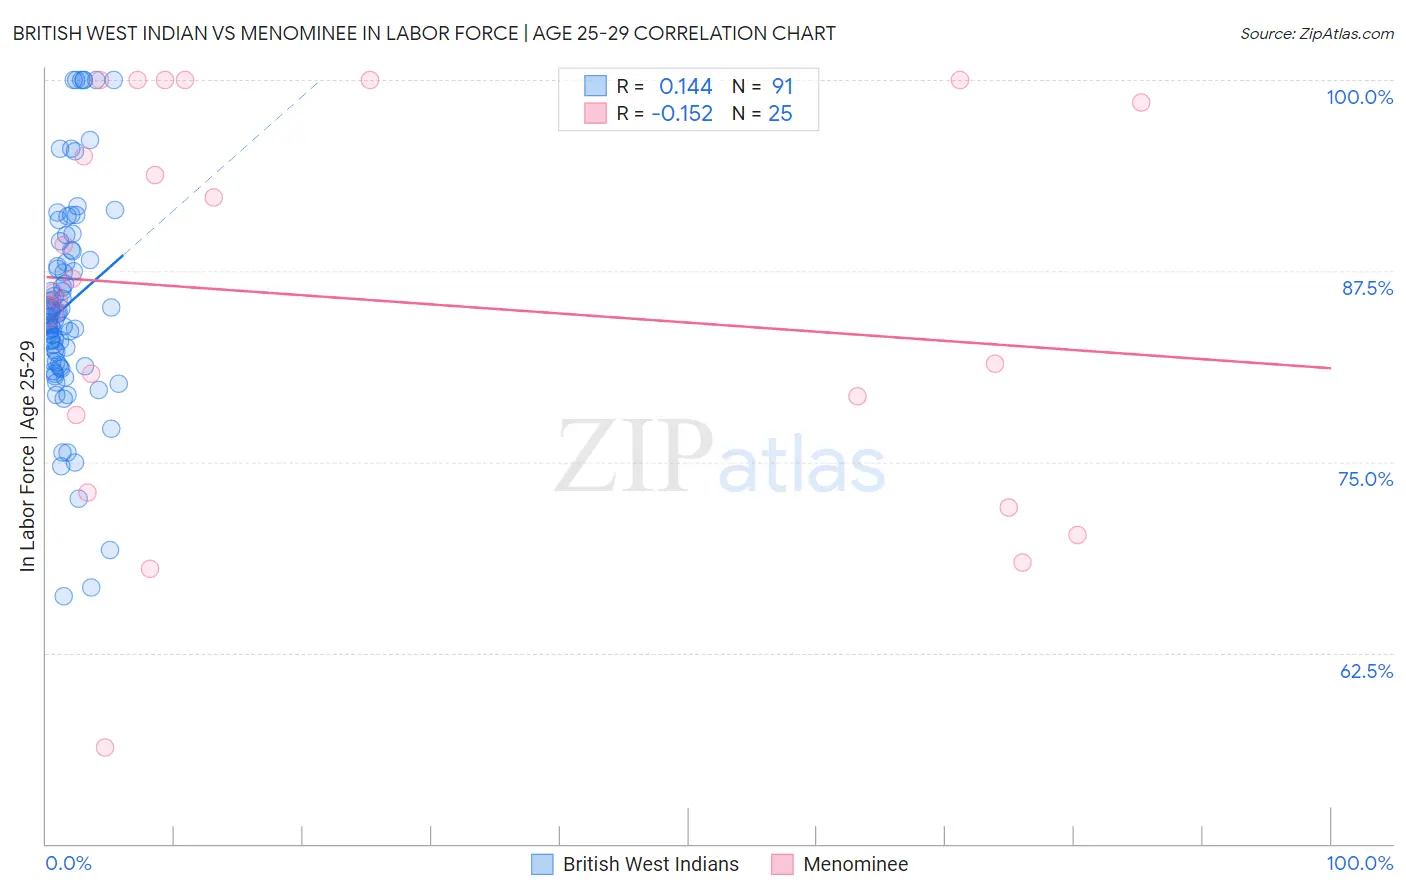
British West Indian vs Menominee In Labor Force | Age 25-29 Correlation Chart
The statistical analysis conducted on geographies consisting of 152,666,042 people shows a poor positive correlation between the proportion of British West Indians and labor force participation rate among population between the ages 25 and 29 in the United States with a correlation coefficient (R) of 0.144 and weighted average of 83.2%. Similarly, the statistical analysis conducted on geographies consisting of 45,777,476 people shows a poor negative correlation between the proportion of Menominee and labor force participation rate among population between the ages 25 and 29 in the United States with a correlation coefficient (R) of -0.152 and weighted average of 85.4%, a difference of 2.6%.
In Labor Force | Age 25-29 Correlation Summary
| Measurement | British West Indian | Menominee |
| Minimum | 66.2% | 56.3% |
| Maximum | 100.0% | 100.0% |
| Range | 33.8% | 43.7% |
| Mean | 85.2% | 85.6% |
| Median | 84.7% | 86.1% |
| Interquartile 25% (IQ1) | 81.3% | 75.5% |
| Interquartile 75% (IQ3) | 88.8% | 99.3% |
| Interquartile Range (IQR) | 7.5% | 23.7% |
| Standard Deviation (Sample) | 7.0% | 12.6% |
| Standard Deviation (Population) | 6.9% | 12.3% |
Similar Demographics by In Labor Force | Age 25-29
Demographics Similar to British West Indians by In Labor Force | Age 25-29
In terms of in labor force | age 25-29, the demographic groups most similar to British West Indians are Immigrants from Cuba (83.2%, a difference of 0.010%), Dominican (83.2%, a difference of 0.020%), African (83.2%, a difference of 0.060%), Immigrants from Dominican Republic (83.1%, a difference of 0.080%), and American (83.1%, a difference of 0.090%).
| Demographics | Rating | Rank | In Labor Force | Age 25-29 |
| Immigrants | Caribbean | 0.0 /100 | #272 | Tragic 83.4% |
| Immigrants | Dominica | 0.0 /100 | #273 | Tragic 83.4% |
| Marshallese | 0.0 /100 | #274 | Tragic 83.3% |
| Samoans | 0.0 /100 | #275 | Tragic 83.3% |
| Immigrants | Honduras | 0.0 /100 | #276 | Tragic 83.3% |
| Africans | 0.0 /100 | #277 | Tragic 83.2% |
| Immigrants | Cuba | 0.0 /100 | #278 | Tragic 83.2% |
| British West Indians | 0.0 /100 | #279 | Tragic 83.2% |
| Dominicans | 0.0 /100 | #280 | Tragic 83.2% |
| Immigrants | Dominican Republic | 0.0 /100 | #281 | Tragic 83.1% |
| Americans | 0.0 /100 | #282 | Tragic 83.1% |
| Immigrants | Azores | 0.0 /100 | #283 | Tragic 83.1% |
| Nicaraguans | 0.0 /100 | #284 | Tragic 83.1% |
| Belizeans | 0.0 /100 | #285 | Tragic 83.1% |
| Mexican American Indians | 0.0 /100 | #286 | Tragic 83.0% |
Demographics Similar to Menominee by In Labor Force | Age 25-29
In terms of in labor force | age 25-29, the demographic groups most similar to Menominee are Immigrants from Sweden (85.4%, a difference of 0.0%), Immigrants from Cameroon (85.4%, a difference of 0.020%), Kenyan (85.4%, a difference of 0.020%), Immigrants from Turkey (85.4%, a difference of 0.030%), and Immigrants from Scotland (85.4%, a difference of 0.040%).
| Demographics | Rating | Rank | In Labor Force | Age 25-29 |
| Taiwanese | 99.4 /100 | #62 | Exceptional 85.4% |
| Immigrants | Kenya | 99.4 /100 | #63 | Exceptional 85.4% |
| Immigrants | Italy | 99.3 /100 | #64 | Exceptional 85.4% |
| Immigrants | Czechoslovakia | 99.3 /100 | #65 | Exceptional 85.4% |
| Immigrants | Scotland | 99.3 /100 | #66 | Exceptional 85.4% |
| Immigrants | Turkey | 99.2 /100 | #67 | Exceptional 85.4% |
| Immigrants | Cameroon | 99.2 /100 | #68 | Exceptional 85.4% |
| Menominee | 99.1 /100 | #69 | Exceptional 85.4% |
| Immigrants | Sweden | 99.1 /100 | #70 | Exceptional 85.4% |
| Kenyans | 99.0 /100 | #71 | Exceptional 85.4% |
| Immigrants | Australia | 98.9 /100 | #72 | Exceptional 85.3% |
| Russians | 98.8 /100 | #73 | Exceptional 85.3% |
| Soviet Union | 98.5 /100 | #74 | Exceptional 85.3% |
| Brazilians | 98.3 /100 | #75 | Exceptional 85.3% |
| Germans | 98.1 /100 | #76 | Exceptional 85.3% |