Comanche vs Lebanese In Labor Force | Age 45-54
COMPARE
Comanche
Lebanese
In Labor Force | Age 45-54
In Labor Force | Age 45-54 Comparison
Comanche
Lebanese
79.2%
IN LABOR FORCE | AGE 45-54
0.0/ 100
METRIC RATING
317th/ 347
METRIC RANK
82.5%
IN LABOR FORCE | AGE 45-54
18.2/ 100
METRIC RATING
197th/ 347
METRIC RANK
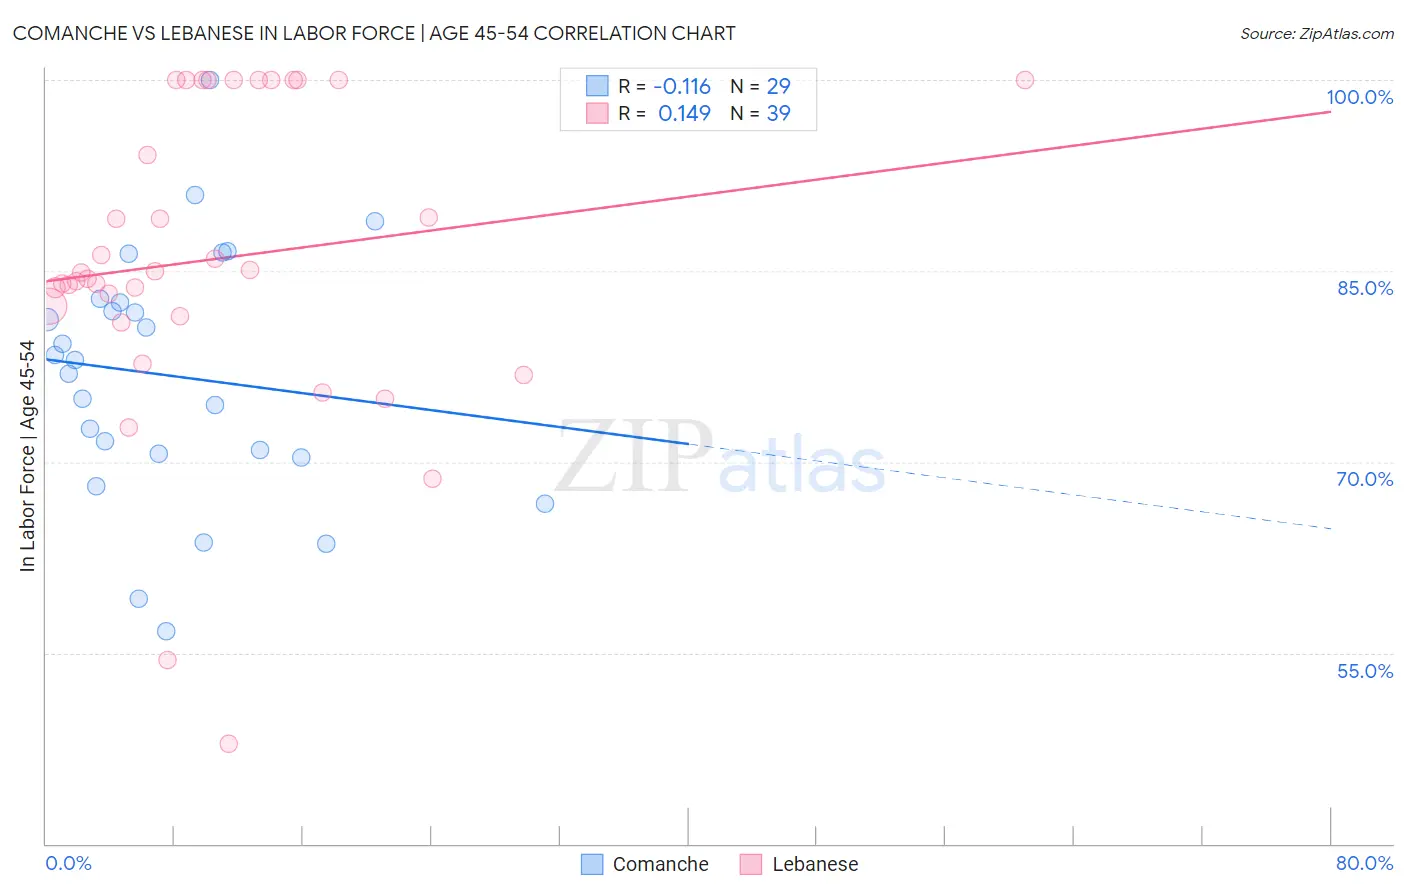
Comanche vs Lebanese In Labor Force | Age 45-54 Correlation Chart
The statistical analysis conducted on geographies consisting of 109,767,543 people shows a poor negative correlation between the proportion of Comanche and labor force participation rate among population between the ages 45 and 54 in the United States with a correlation coefficient (R) of -0.116 and weighted average of 79.2%. Similarly, the statistical analysis conducted on geographies consisting of 401,315,203 people shows a poor positive correlation between the proportion of Lebanese and labor force participation rate among population between the ages 45 and 54 in the United States with a correlation coefficient (R) of 0.149 and weighted average of 82.5%, a difference of 4.2%.
In Labor Force | Age 45-54 Correlation Summary
| Measurement | Comanche | Lebanese |
| Minimum | 56.7% | 47.9% |
| Maximum | 100.0% | 100.0% |
| Range | 43.3% | 52.1% |
| Mean | 76.8% | 86.0% |
| Median | 78.0% | 84.9% |
| Interquartile 25% (IQ1) | 70.5% | 81.5% |
| Interquartile 75% (IQ3) | 82.7% | 100.0% |
| Interquartile Range (IQR) | 12.2% | 18.5% |
| Standard Deviation (Sample) | 9.9% | 12.2% |
| Standard Deviation (Population) | 9.7% | 12.0% |
Similar Demographics by In Labor Force | Age 45-54
Demographics Similar to Comanche by In Labor Force | Age 45-54
In terms of in labor force | age 45-54, the demographic groups most similar to Comanche are Shoshone (79.3%, a difference of 0.13%), Chickasaw (79.0%, a difference of 0.17%), Black/African American (79.3%, a difference of 0.22%), Cherokee (79.0%, a difference of 0.28%), and Ottawa (79.5%, a difference of 0.35%).
| Demographics | Rating | Rank | In Labor Force | Age 45-54 |
| Inupiat | 0.0 /100 | #310 | Tragic 79.9% |
| Mexicans | 0.0 /100 | #311 | Tragic 79.8% |
| Immigrants | Mexico | 0.0 /100 | #312 | Tragic 79.7% |
| Colville | 0.0 /100 | #313 | Tragic 79.5% |
| Ottawa | 0.0 /100 | #314 | Tragic 79.5% |
| Blacks/African Americans | 0.0 /100 | #315 | Tragic 79.3% |
| Shoshone | 0.0 /100 | #316 | Tragic 79.3% |
| Comanche | 0.0 /100 | #317 | Tragic 79.2% |
| Chickasaw | 0.0 /100 | #318 | Tragic 79.0% |
| Cherokee | 0.0 /100 | #319 | Tragic 79.0% |
| Yaqui | 0.0 /100 | #320 | Tragic 78.9% |
| Yup'ik | 0.0 /100 | #321 | Tragic 78.6% |
| Crow | 0.0 /100 | #322 | Tragic 78.3% |
| Kiowa | 0.0 /100 | #323 | Tragic 78.3% |
| Dutch West Indians | 0.0 /100 | #324 | Tragic 78.2% |
Demographics Similar to Lebanese by In Labor Force | Age 45-54
In terms of in labor force | age 45-54, the demographic groups most similar to Lebanese are Immigrants from North America (82.5%, a difference of 0.010%), Immigrants from Denmark (82.5%, a difference of 0.010%), Immigrants from Norway (82.5%, a difference of 0.030%), Immigrants from Canada (82.5%, a difference of 0.030%), and Immigrants from Iraq (82.5%, a difference of 0.040%).
| Demographics | Rating | Rank | In Labor Force | Age 45-54 |
| British | 25.7 /100 | #190 | Fair 82.6% |
| Armenians | 23.2 /100 | #191 | Fair 82.5% |
| Immigrants | Iraq | 20.9 /100 | #192 | Fair 82.5% |
| Australians | 20.8 /100 | #193 | Fair 82.5% |
| Immigrants | Norway | 20.7 /100 | #194 | Fair 82.5% |
| Immigrants | Canada | 20.0 /100 | #195 | Fair 82.5% |
| Immigrants | North America | 18.8 /100 | #196 | Poor 82.5% |
| Lebanese | 18.2 /100 | #197 | Poor 82.5% |
| Immigrants | Denmark | 17.9 /100 | #198 | Poor 82.5% |
| Moroccans | 15.7 /100 | #199 | Poor 82.5% |
| French Canadians | 15.4 /100 | #200 | Poor 82.5% |
| Canadians | 15.1 /100 | #201 | Poor 82.4% |
| Immigrants | Western Asia | 14.9 /100 | #202 | Poor 82.4% |
| Arabs | 11.6 /100 | #203 | Poor 82.4% |
| Immigrants | Western Europe | 10.9 /100 | #204 | Poor 82.4% |