Comanche vs Immigrants from Burma/Myanmar In Labor Force | Age 45-54
COMPARE
Comanche
Immigrants from Burma/Myanmar
In Labor Force | Age 45-54
In Labor Force | Age 45-54 Comparison
Comanche
Immigrants from Burma/Myanmar
79.2%
IN LABOR FORCE | AGE 45-54
0.0/ 100
METRIC RATING
317th/ 347
METRIC RANK
82.0%
IN LABOR FORCE | AGE 45-54
1.9/ 100
METRIC RATING
229th/ 347
METRIC RANK
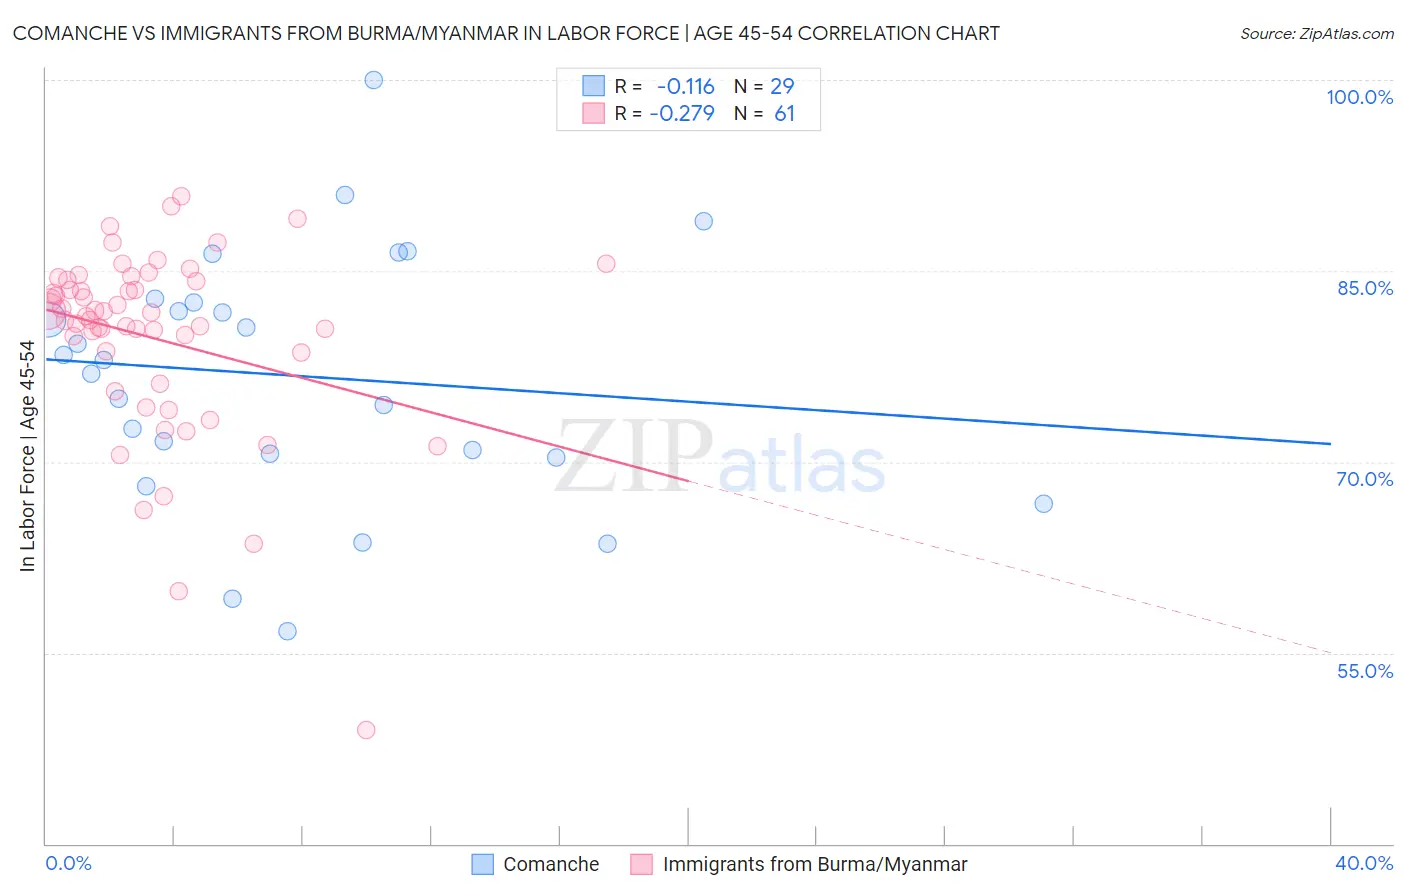
Comanche vs Immigrants from Burma/Myanmar In Labor Force | Age 45-54 Correlation Chart
The statistical analysis conducted on geographies consisting of 109,767,543 people shows a poor negative correlation between the proportion of Comanche and labor force participation rate among population between the ages 45 and 54 in the United States with a correlation coefficient (R) of -0.116 and weighted average of 79.2%. Similarly, the statistical analysis conducted on geographies consisting of 172,276,017 people shows a weak negative correlation between the proportion of Immigrants from Burma/Myanmar and labor force participation rate among population between the ages 45 and 54 in the United States with a correlation coefficient (R) of -0.279 and weighted average of 82.0%, a difference of 3.6%.
In Labor Force | Age 45-54 Correlation Summary
| Measurement | Comanche | Immigrants from Burma/Myanmar |
| Minimum | 56.7% | 48.9% |
| Maximum | 100.0% | 90.9% |
| Range | 43.3% | 42.0% |
| Mean | 76.8% | 79.7% |
| Median | 78.0% | 81.5% |
| Interquartile 25% (IQ1) | 70.5% | 77.4% |
| Interquartile 75% (IQ3) | 82.7% | 84.3% |
| Interquartile Range (IQR) | 12.2% | 6.9% |
| Standard Deviation (Sample) | 9.9% | 7.5% |
| Standard Deviation (Population) | 9.7% | 7.4% |
Similar Demographics by In Labor Force | Age 45-54
Demographics Similar to Comanche by In Labor Force | Age 45-54
In terms of in labor force | age 45-54, the demographic groups most similar to Comanche are Shoshone (79.3%, a difference of 0.13%), Chickasaw (79.0%, a difference of 0.17%), Black/African American (79.3%, a difference of 0.22%), Cherokee (79.0%, a difference of 0.28%), and Ottawa (79.5%, a difference of 0.35%).
| Demographics | Rating | Rank | In Labor Force | Age 45-54 |
| Inupiat | 0.0 /100 | #310 | Tragic 79.9% |
| Mexicans | 0.0 /100 | #311 | Tragic 79.8% |
| Immigrants | Mexico | 0.0 /100 | #312 | Tragic 79.7% |
| Colville | 0.0 /100 | #313 | Tragic 79.5% |
| Ottawa | 0.0 /100 | #314 | Tragic 79.5% |
| Blacks/African Americans | 0.0 /100 | #315 | Tragic 79.3% |
| Shoshone | 0.0 /100 | #316 | Tragic 79.3% |
| Comanche | 0.0 /100 | #317 | Tragic 79.2% |
| Chickasaw | 0.0 /100 | #318 | Tragic 79.0% |
| Cherokee | 0.0 /100 | #319 | Tragic 79.0% |
| Yaqui | 0.0 /100 | #320 | Tragic 78.9% |
| Yup'ik | 0.0 /100 | #321 | Tragic 78.6% |
| Crow | 0.0 /100 | #322 | Tragic 78.3% |
| Kiowa | 0.0 /100 | #323 | Tragic 78.3% |
| Dutch West Indians | 0.0 /100 | #324 | Tragic 78.2% |
Demographics Similar to Immigrants from Burma/Myanmar by In Labor Force | Age 45-54
In terms of in labor force | age 45-54, the demographic groups most similar to Immigrants from Burma/Myanmar are Jamaican (82.0%, a difference of 0.010%), Cape Verdean (82.1%, a difference of 0.020%), Immigrants from Senegal (82.0%, a difference of 0.030%), Immigrants from Portugal (82.0%, a difference of 0.030%), and Malaysian (82.0%, a difference of 0.030%).
| Demographics | Rating | Rank | In Labor Force | Age 45-54 |
| Immigrants | Ecuador | 3.4 /100 | #222 | Tragic 82.2% |
| Immigrants | Immigrants | 3.1 /100 | #223 | Tragic 82.1% |
| Immigrants | Jamaica | 2.7 /100 | #224 | Tragic 82.1% |
| Immigrants | Oceania | 2.5 /100 | #225 | Tragic 82.1% |
| Immigrants | Caribbean | 2.5 /100 | #226 | Tragic 82.1% |
| Immigrants | Germany | 2.4 /100 | #227 | Tragic 82.1% |
| Cape Verdeans | 2.1 /100 | #228 | Tragic 82.1% |
| Immigrants | Burma/Myanmar | 1.9 /100 | #229 | Tragic 82.0% |
| Jamaicans | 1.8 /100 | #230 | Tragic 82.0% |
| Immigrants | Senegal | 1.7 /100 | #231 | Tragic 82.0% |
| Immigrants | Portugal | 1.7 /100 | #232 | Tragic 82.0% |
| Malaysians | 1.7 /100 | #233 | Tragic 82.0% |
| Salvadorans | 1.7 /100 | #234 | Tragic 82.0% |
| Sub-Saharan Africans | 1.2 /100 | #235 | Tragic 82.0% |
| Basques | 1.2 /100 | #236 | Tragic 82.0% |