Choctaw vs Immigrants from Burma/Myanmar In Labor Force | Age 45-54
COMPARE
Choctaw
Immigrants from Burma/Myanmar
In Labor Force | Age 45-54
In Labor Force | Age 45-54 Comparison
Choctaw
Immigrants from Burma/Myanmar
78.2%
IN LABOR FORCE | AGE 45-54
0.0/ 100
METRIC RATING
325th/ 347
METRIC RANK
82.0%
IN LABOR FORCE | AGE 45-54
1.9/ 100
METRIC RATING
229th/ 347
METRIC RANK
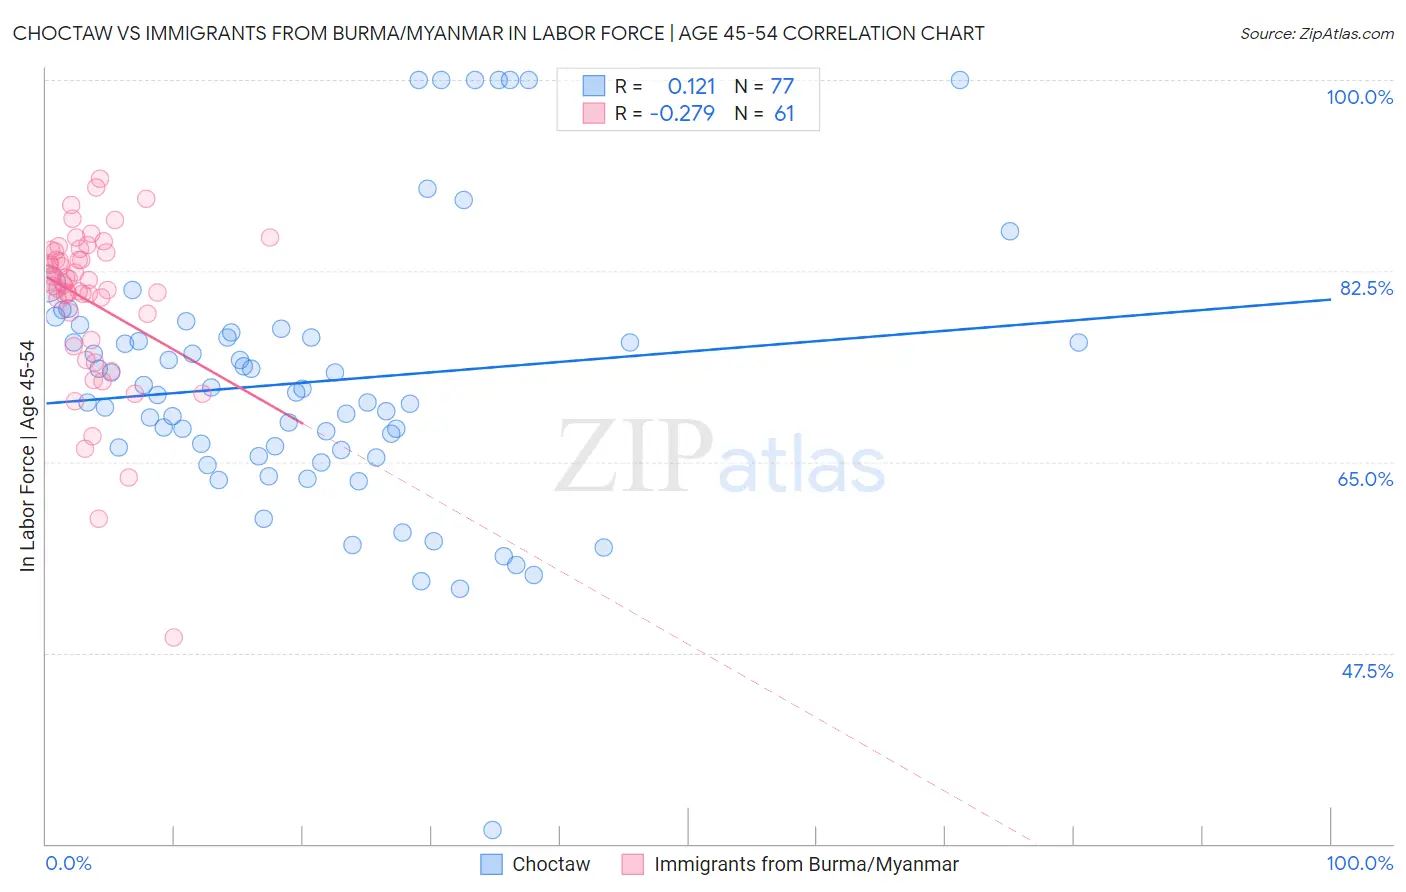
Choctaw vs Immigrants from Burma/Myanmar In Labor Force | Age 45-54 Correlation Chart
The statistical analysis conducted on geographies consisting of 269,621,140 people shows a poor positive correlation between the proportion of Choctaw and labor force participation rate among population between the ages 45 and 54 in the United States with a correlation coefficient (R) of 0.121 and weighted average of 78.2%. Similarly, the statistical analysis conducted on geographies consisting of 172,276,017 people shows a weak negative correlation between the proportion of Immigrants from Burma/Myanmar and labor force participation rate among population between the ages 45 and 54 in the United States with a correlation coefficient (R) of -0.279 and weighted average of 82.0%, a difference of 5.0%.
In Labor Force | Age 45-54 Correlation Summary
| Measurement | Choctaw | Immigrants from Burma/Myanmar |
| Minimum | 31.3% | 48.9% |
| Maximum | 100.0% | 90.9% |
| Range | 68.7% | 42.0% |
| Mean | 72.4% | 79.7% |
| Median | 71.3% | 81.5% |
| Interquartile 25% (IQ1) | 65.8% | 77.4% |
| Interquartile 75% (IQ3) | 76.6% | 84.3% |
| Interquartile Range (IQR) | 10.8% | 6.9% |
| Standard Deviation (Sample) | 12.4% | 7.5% |
| Standard Deviation (Population) | 12.3% | 7.4% |
Similar Demographics by In Labor Force | Age 45-54
Demographics Similar to Choctaw by In Labor Force | Age 45-54
In terms of in labor force | age 45-54, the demographic groups most similar to Choctaw are Seminole (78.1%, a difference of 0.050%), Cajun (78.1%, a difference of 0.050%), Dutch West Indian (78.2%, a difference of 0.090%), Kiowa (78.3%, a difference of 0.11%), and Crow (78.3%, a difference of 0.20%).
| Demographics | Rating | Rank | In Labor Force | Age 45-54 |
| Chickasaw | 0.0 /100 | #318 | Tragic 79.0% |
| Cherokee | 0.0 /100 | #319 | Tragic 79.0% |
| Yaqui | 0.0 /100 | #320 | Tragic 78.9% |
| Yup'ik | 0.0 /100 | #321 | Tragic 78.6% |
| Crow | 0.0 /100 | #322 | Tragic 78.3% |
| Kiowa | 0.0 /100 | #323 | Tragic 78.3% |
| Dutch West Indians | 0.0 /100 | #324 | Tragic 78.2% |
| Choctaw | 0.0 /100 | #325 | Tragic 78.2% |
| Seminole | 0.0 /100 | #326 | Tragic 78.1% |
| Cajuns | 0.0 /100 | #327 | Tragic 78.1% |
| Sioux | 0.0 /100 | #328 | Tragic 78.0% |
| Creek | 0.0 /100 | #329 | Tragic 77.7% |
| Cheyenne | 0.0 /100 | #330 | Tragic 77.6% |
| Tsimshian | 0.0 /100 | #331 | Tragic 77.4% |
| Menominee | 0.0 /100 | #332 | Tragic 77.4% |
Demographics Similar to Immigrants from Burma/Myanmar by In Labor Force | Age 45-54
In terms of in labor force | age 45-54, the demographic groups most similar to Immigrants from Burma/Myanmar are Jamaican (82.0%, a difference of 0.010%), Cape Verdean (82.1%, a difference of 0.020%), Immigrants from Senegal (82.0%, a difference of 0.030%), Immigrants from Portugal (82.0%, a difference of 0.030%), and Malaysian (82.0%, a difference of 0.030%).
| Demographics | Rating | Rank | In Labor Force | Age 45-54 |
| Immigrants | Ecuador | 3.4 /100 | #222 | Tragic 82.2% |
| Immigrants | Immigrants | 3.1 /100 | #223 | Tragic 82.1% |
| Immigrants | Jamaica | 2.7 /100 | #224 | Tragic 82.1% |
| Immigrants | Oceania | 2.5 /100 | #225 | Tragic 82.1% |
| Immigrants | Caribbean | 2.5 /100 | #226 | Tragic 82.1% |
| Immigrants | Germany | 2.4 /100 | #227 | Tragic 82.1% |
| Cape Verdeans | 2.1 /100 | #228 | Tragic 82.1% |
| Immigrants | Burma/Myanmar | 1.9 /100 | #229 | Tragic 82.0% |
| Jamaicans | 1.8 /100 | #230 | Tragic 82.0% |
| Immigrants | Senegal | 1.7 /100 | #231 | Tragic 82.0% |
| Immigrants | Portugal | 1.7 /100 | #232 | Tragic 82.0% |
| Malaysians | 1.7 /100 | #233 | Tragic 82.0% |
| Salvadorans | 1.7 /100 | #234 | Tragic 82.0% |
| Sub-Saharan Africans | 1.2 /100 | #235 | Tragic 82.0% |
| Basques | 1.2 /100 | #236 | Tragic 82.0% |