Comanche vs Immigrants from West Indies In Labor Force | Age 45-54
COMPARE
Comanche
Immigrants from West Indies
In Labor Force | Age 45-54
In Labor Force | Age 45-54 Comparison
Comanche
Immigrants from West Indies
79.2%
IN LABOR FORCE | AGE 45-54
0.0/ 100
METRIC RATING
317th/ 347
METRIC RANK
81.5%
IN LABOR FORCE | AGE 45-54
0.1/ 100
METRIC RATING
264th/ 347
METRIC RANK
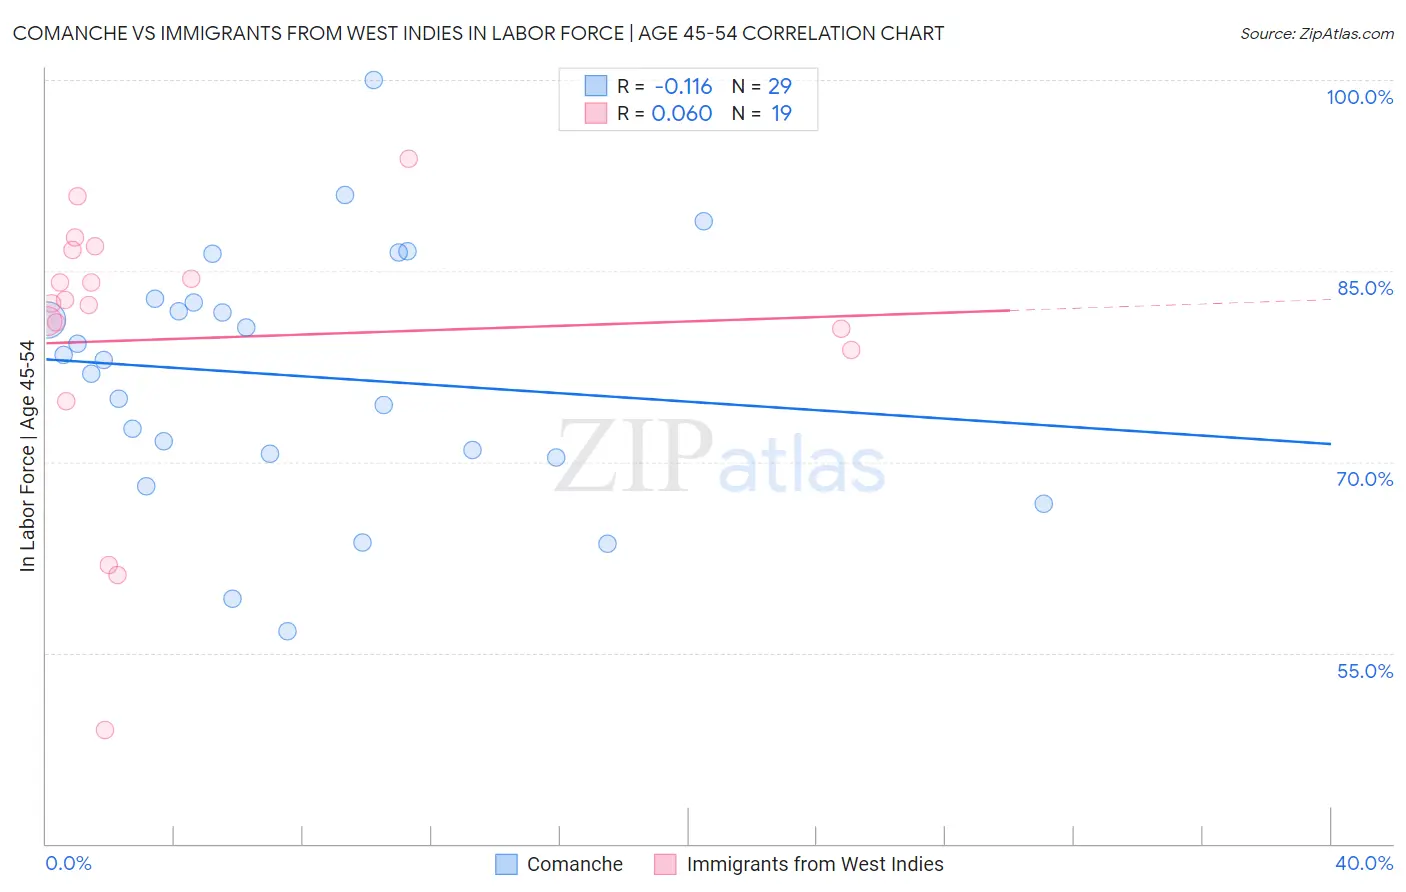
Comanche vs Immigrants from West Indies In Labor Force | Age 45-54 Correlation Chart
The statistical analysis conducted on geographies consisting of 109,767,543 people shows a poor negative correlation between the proportion of Comanche and labor force participation rate among population between the ages 45 and 54 in the United States with a correlation coefficient (R) of -0.116 and weighted average of 79.2%. Similarly, the statistical analysis conducted on geographies consisting of 72,454,628 people shows a slight positive correlation between the proportion of Immigrants from West Indies and labor force participation rate among population between the ages 45 and 54 in the United States with a correlation coefficient (R) of 0.060 and weighted average of 81.5%, a difference of 2.9%.
In Labor Force | Age 45-54 Correlation Summary
| Measurement | Comanche | Immigrants from West Indies |
| Minimum | 56.7% | 48.9% |
| Maximum | 100.0% | 93.8% |
| Range | 43.3% | 44.9% |
| Mean | 76.8% | 79.7% |
| Median | 78.0% | 82.4% |
| Interquartile 25% (IQ1) | 70.5% | 78.8% |
| Interquartile 75% (IQ3) | 82.7% | 86.6% |
| Interquartile Range (IQR) | 12.2% | 7.8% |
| Standard Deviation (Sample) | 9.9% | 11.1% |
| Standard Deviation (Population) | 9.7% | 10.8% |
Similar Demographics by In Labor Force | Age 45-54
Demographics Similar to Comanche by In Labor Force | Age 45-54
In terms of in labor force | age 45-54, the demographic groups most similar to Comanche are Shoshone (79.3%, a difference of 0.13%), Chickasaw (79.0%, a difference of 0.17%), Black/African American (79.3%, a difference of 0.22%), Cherokee (79.0%, a difference of 0.28%), and Ottawa (79.5%, a difference of 0.35%).
| Demographics | Rating | Rank | In Labor Force | Age 45-54 |
| Inupiat | 0.0 /100 | #310 | Tragic 79.9% |
| Mexicans | 0.0 /100 | #311 | Tragic 79.8% |
| Immigrants | Mexico | 0.0 /100 | #312 | Tragic 79.7% |
| Colville | 0.0 /100 | #313 | Tragic 79.5% |
| Ottawa | 0.0 /100 | #314 | Tragic 79.5% |
| Blacks/African Americans | 0.0 /100 | #315 | Tragic 79.3% |
| Shoshone | 0.0 /100 | #316 | Tragic 79.3% |
| Comanche | 0.0 /100 | #317 | Tragic 79.2% |
| Chickasaw | 0.0 /100 | #318 | Tragic 79.0% |
| Cherokee | 0.0 /100 | #319 | Tragic 79.0% |
| Yaqui | 0.0 /100 | #320 | Tragic 78.9% |
| Yup'ik | 0.0 /100 | #321 | Tragic 78.6% |
| Crow | 0.0 /100 | #322 | Tragic 78.3% |
| Kiowa | 0.0 /100 | #323 | Tragic 78.3% |
| Dutch West Indians | 0.0 /100 | #324 | Tragic 78.2% |
Demographics Similar to Immigrants from West Indies by In Labor Force | Age 45-54
In terms of in labor force | age 45-54, the demographic groups most similar to Immigrants from West Indies are Indonesian (81.5%, a difference of 0.010%), Hawaiian (81.5%, a difference of 0.020%), Immigrants from Guyana (81.5%, a difference of 0.020%), Spaniard (81.5%, a difference of 0.030%), and Honduran (81.4%, a difference of 0.050%).
| Demographics | Rating | Rank | In Labor Force | Age 45-54 |
| Immigrants | Congo | 0.1 /100 | #257 | Tragic 81.6% |
| Immigrants | Fiji | 0.1 /100 | #258 | Tragic 81.5% |
| Guyanese | 0.1 /100 | #259 | Tragic 81.5% |
| Spaniards | 0.1 /100 | #260 | Tragic 81.5% |
| Hawaiians | 0.1 /100 | #261 | Tragic 81.5% |
| Immigrants | Guyana | 0.1 /100 | #262 | Tragic 81.5% |
| Indonesians | 0.1 /100 | #263 | Tragic 81.5% |
| Immigrants | West Indies | 0.1 /100 | #264 | Tragic 81.5% |
| Hondurans | 0.1 /100 | #265 | Tragic 81.4% |
| Immigrants | St. Vincent and the Grenadines | 0.1 /100 | #266 | Tragic 81.4% |
| West Indians | 0.1 /100 | #267 | Tragic 81.4% |
| Immigrants | Honduras | 0.0 /100 | #268 | Tragic 81.4% |
| Alsatians | 0.0 /100 | #269 | Tragic 81.3% |
| Bangladeshis | 0.0 /100 | #270 | Tragic 81.3% |
| Immigrants | Barbados | 0.0 /100 | #271 | Tragic 81.3% |