Colville vs Bulgarian In Labor Force | Age 20-64
COMPARE
Colville
Bulgarian
In Labor Force | Age 20-64
In Labor Force | Age 20-64 Comparison
Colville
Bulgarians
74.8%
IN LABOR FORCE | AGE 20-64
0.0/ 100
METRIC RATING
330th/ 347
METRIC RANK
81.1%
IN LABOR FORCE | AGE 20-64
100.0/ 100
METRIC RATING
15th/ 347
METRIC RANK
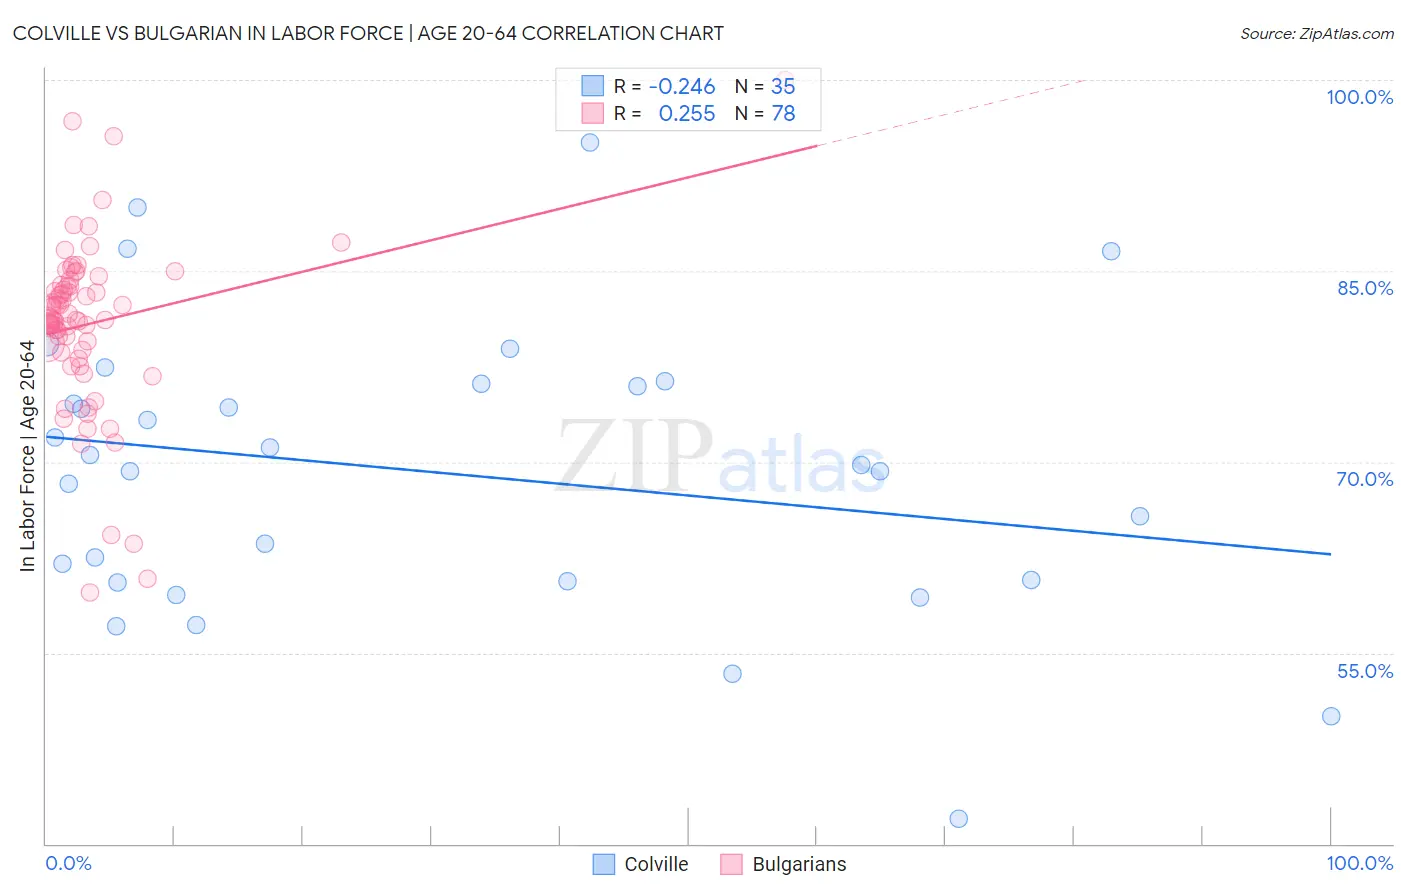
Colville vs Bulgarian In Labor Force | Age 20-64 Correlation Chart
The statistical analysis conducted on geographies consisting of 34,687,839 people shows a weak negative correlation between the proportion of Colville and labor force participation rate among population between the ages 20 and 64 in the United States with a correlation coefficient (R) of -0.246 and weighted average of 74.8%. Similarly, the statistical analysis conducted on geographies consisting of 205,633,512 people shows a weak positive correlation between the proportion of Bulgarians and labor force participation rate among population between the ages 20 and 64 in the United States with a correlation coefficient (R) of 0.255 and weighted average of 81.1%, a difference of 8.4%.
In Labor Force | Age 20-64 Correlation Summary
| Measurement | Colville | Bulgarian |
| Minimum | 42.0% | 59.8% |
| Maximum | 95.1% | 100.0% |
| Range | 53.1% | 40.2% |
| Mean | 69.2% | 80.8% |
| Median | 69.8% | 81.2% |
| Interquartile 25% (IQ1) | 60.6% | 78.8% |
| Interquartile 75% (IQ3) | 76.1% | 83.8% |
| Interquartile Range (IQR) | 15.5% | 5.1% |
| Standard Deviation (Sample) | 11.4% | 6.7% |
| Standard Deviation (Population) | 11.3% | 6.6% |
Similar Demographics by In Labor Force | Age 20-64
Demographics Similar to Colville by In Labor Force | Age 20-64
In terms of in labor force | age 20-64, the demographic groups most similar to Colville are Cheyenne (74.8%, a difference of 0.070%), Paiute (74.7%, a difference of 0.13%), Kiowa (75.0%, a difference of 0.26%), Sioux (75.0%, a difference of 0.29%), and Creek (75.1%, a difference of 0.47%).
| Demographics | Rating | Rank | In Labor Force | Age 20-64 |
| Cajuns | 0.0 /100 | #323 | Tragic 75.5% |
| Choctaw | 0.0 /100 | #324 | Tragic 75.4% |
| Menominee | 0.0 /100 | #325 | Tragic 75.3% |
| Creek | 0.0 /100 | #326 | Tragic 75.1% |
| Sioux | 0.0 /100 | #327 | Tragic 75.0% |
| Kiowa | 0.0 /100 | #328 | Tragic 75.0% |
| Cheyenne | 0.0 /100 | #329 | Tragic 74.8% |
| Colville | 0.0 /100 | #330 | Tragic 74.8% |
| Paiute | 0.0 /100 | #331 | Tragic 74.7% |
| Arapaho | 0.0 /100 | #332 | Tragic 74.4% |
| Natives/Alaskans | 0.0 /100 | #333 | Tragic 73.9% |
| Apache | 0.0 /100 | #334 | Tragic 73.7% |
| Ute | 0.0 /100 | #335 | Tragic 73.7% |
| Crow | 0.0 /100 | #336 | Tragic 73.3% |
| Yup'ik | 0.0 /100 | #337 | Tragic 73.2% |
Demographics Similar to Bulgarians by In Labor Force | Age 20-64
In terms of in labor force | age 20-64, the demographic groups most similar to Bulgarians are Immigrants from Nepal (81.1%, a difference of 0.0%), Cambodian (81.1%, a difference of 0.010%), Norwegian (81.0%, a difference of 0.11%), Immigrants from Bulgaria (81.0%, a difference of 0.12%), and Zimbabwean (81.0%, a difference of 0.12%).
| Demographics | Rating | Rank | In Labor Force | Age 20-64 |
| Immigrants | Somalia | 100.0 /100 | #8 | Exceptional 81.6% |
| Sierra Leoneans | 100.0 /100 | #9 | Exceptional 81.5% |
| Immigrants | Sierra Leone | 100.0 /100 | #10 | Exceptional 81.5% |
| Immigrants | Eastern Africa | 100.0 /100 | #11 | Exceptional 81.3% |
| Immigrants | Eritrea | 100.0 /100 | #12 | Exceptional 81.3% |
| Immigrants | India | 100.0 /100 | #13 | Exceptional 81.3% |
| Cambodians | 100.0 /100 | #14 | Exceptional 81.1% |
| Bulgarians | 100.0 /100 | #15 | Exceptional 81.1% |
| Immigrants | Nepal | 100.0 /100 | #16 | Exceptional 81.1% |
| Norwegians | 100.0 /100 | #17 | Exceptional 81.0% |
| Immigrants | Bulgaria | 100.0 /100 | #18 | Exceptional 81.0% |
| Zimbabweans | 100.0 /100 | #19 | Exceptional 81.0% |
| Thais | 100.0 /100 | #20 | Exceptional 80.9% |
| Liberians | 100.0 /100 | #21 | Exceptional 80.9% |
| Sudanese | 100.0 /100 | #22 | Exceptional 80.8% |