Choctaw vs Immigrants from Egypt In Labor Force | Age 20-24
COMPARE
Choctaw
Immigrants from Egypt
In Labor Force | Age 20-24
In Labor Force | Age 20-24 Comparison
Choctaw
Immigrants from Egypt
74.7%
IN LABOR FORCE | AGE 20-24
21.4/ 100
METRIC RATING
201st/ 347
METRIC RANK
73.8%
IN LABOR FORCE | AGE 20-24
1.2/ 100
METRIC RATING
251st/ 347
METRIC RANK
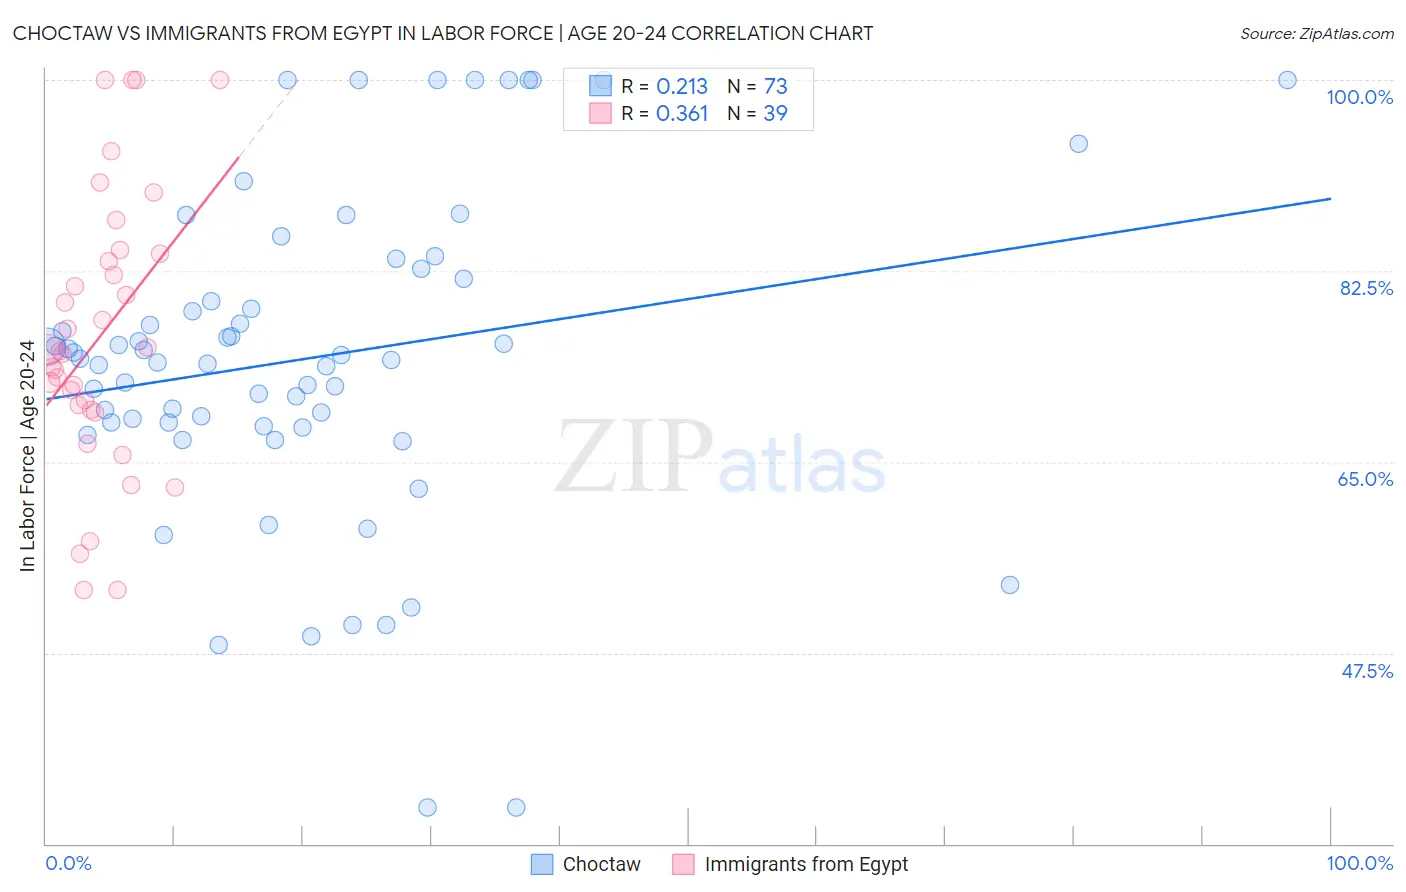
Choctaw vs Immigrants from Egypt In Labor Force | Age 20-24 Correlation Chart
The statistical analysis conducted on geographies consisting of 269,558,461 people shows a weak positive correlation between the proportion of Choctaw and labor force participation rate among population between the ages 20 and 24 in the United States with a correlation coefficient (R) of 0.213 and weighted average of 74.7%. Similarly, the statistical analysis conducted on geographies consisting of 245,464,045 people shows a mild positive correlation between the proportion of Immigrants from Egypt and labor force participation rate among population between the ages 20 and 24 in the United States with a correlation coefficient (R) of 0.361 and weighted average of 73.8%, a difference of 1.2%.
In Labor Force | Age 20-24 Correlation Summary
| Measurement | Choctaw | Immigrants from Egypt |
| Minimum | 33.3% | 53.2% |
| Maximum | 100.0% | 100.0% |
| Range | 66.7% | 46.8% |
| Mean | 74.5% | 76.6% |
| Median | 74.5% | 75.1% |
| Interquartile 25% (IQ1) | 68.4% | 69.7% |
| Interquartile 75% (IQ3) | 82.2% | 84.1% |
| Interquartile Range (IQR) | 13.8% | 14.4% |
| Standard Deviation (Sample) | 14.8% | 12.5% |
| Standard Deviation (Population) | 14.7% | 12.3% |
Similar Demographics by In Labor Force | Age 20-24
Demographics Similar to Choctaw by In Labor Force | Age 20-24
In terms of in labor force | age 20-24, the demographic groups most similar to Choctaw are Nigerian (74.7%, a difference of 0.010%), Moroccan (74.7%, a difference of 0.020%), Taiwanese (74.7%, a difference of 0.040%), Immigrants from Nigeria (74.7%, a difference of 0.060%), and Eastern European (74.8%, a difference of 0.080%).
| Demographics | Rating | Rank | In Labor Force | Age 20-24 |
| Immigrants | Denmark | 25.8 /100 | #194 | Fair 74.8% |
| Eastern Europeans | 25.4 /100 | #195 | Fair 74.8% |
| Immigrants | Vietnam | 25.1 /100 | #196 | Fair 74.7% |
| Panamanians | 25.0 /100 | #197 | Fair 74.7% |
| Immigrants | Nigeria | 24.2 /100 | #198 | Fair 74.7% |
| Taiwanese | 23.2 /100 | #199 | Fair 74.7% |
| Nigerians | 21.9 /100 | #200 | Fair 74.7% |
| Choctaw | 21.4 /100 | #201 | Fair 74.7% |
| Moroccans | 20.4 /100 | #202 | Fair 74.7% |
| Immigrants | Northern Africa | 17.9 /100 | #203 | Poor 74.6% |
| Immigrants | Italy | 17.6 /100 | #204 | Poor 74.6% |
| Inupiat | 17.6 /100 | #205 | Poor 74.6% |
| Sioux | 17.5 /100 | #206 | Poor 74.6% |
| Albanians | 16.2 /100 | #207 | Poor 74.6% |
| Immigrants | Uruguay | 15.8 /100 | #208 | Poor 74.6% |
Demographics Similar to Immigrants from Egypt by In Labor Force | Age 20-24
In terms of in labor force | age 20-24, the demographic groups most similar to Immigrants from Egypt are Black/African American (73.9%, a difference of 0.020%), Immigrants from Belgium (73.9%, a difference of 0.020%), Immigrants from Kazakhstan (73.8%, a difference of 0.020%), Immigrants from Saudi Arabia (73.9%, a difference of 0.070%), and Arapaho (73.8%, a difference of 0.070%).
| Demographics | Rating | Rank | In Labor Force | Age 20-24 |
| Immigrants | South Central Asia | 1.9 /100 | #244 | Tragic 74.0% |
| Turks | 1.8 /100 | #245 | Tragic 73.9% |
| Immigrants | Panama | 1.6 /100 | #246 | Tragic 73.9% |
| Colville | 1.5 /100 | #247 | Tragic 73.9% |
| Immigrants | Saudi Arabia | 1.5 /100 | #248 | Tragic 73.9% |
| Blacks/African Americans | 1.3 /100 | #249 | Tragic 73.9% |
| Immigrants | Belgium | 1.3 /100 | #250 | Tragic 73.9% |
| Immigrants | Egypt | 1.2 /100 | #251 | Tragic 73.8% |
| Immigrants | Kazakhstan | 1.1 /100 | #252 | Tragic 73.8% |
| Arapaho | 1.0 /100 | #253 | Tragic 73.8% |
| Ute | 1.0 /100 | #254 | Tragic 73.8% |
| Immigrants | Pakistan | 0.9 /100 | #255 | Tragic 73.8% |
| Spanish American Indians | 0.8 /100 | #256 | Tragic 73.7% |
| Paraguayans | 0.8 /100 | #257 | Tragic 73.7% |
| Egyptians | 0.7 /100 | #258 | Tragic 73.7% |