Chilean vs Austrian In Labor Force | Age 45-54
COMPARE
Chilean
Austrian
In Labor Force | Age 45-54
In Labor Force | Age 45-54 Comparison
Chileans
Austrians
83.4%
IN LABOR FORCE | AGE 45-54
97.7/ 100
METRIC RATING
67th/ 347
METRIC RANK
83.0%
IN LABOR FORCE | AGE 45-54
81.3/ 100
METRIC RATING
135th/ 347
METRIC RANK
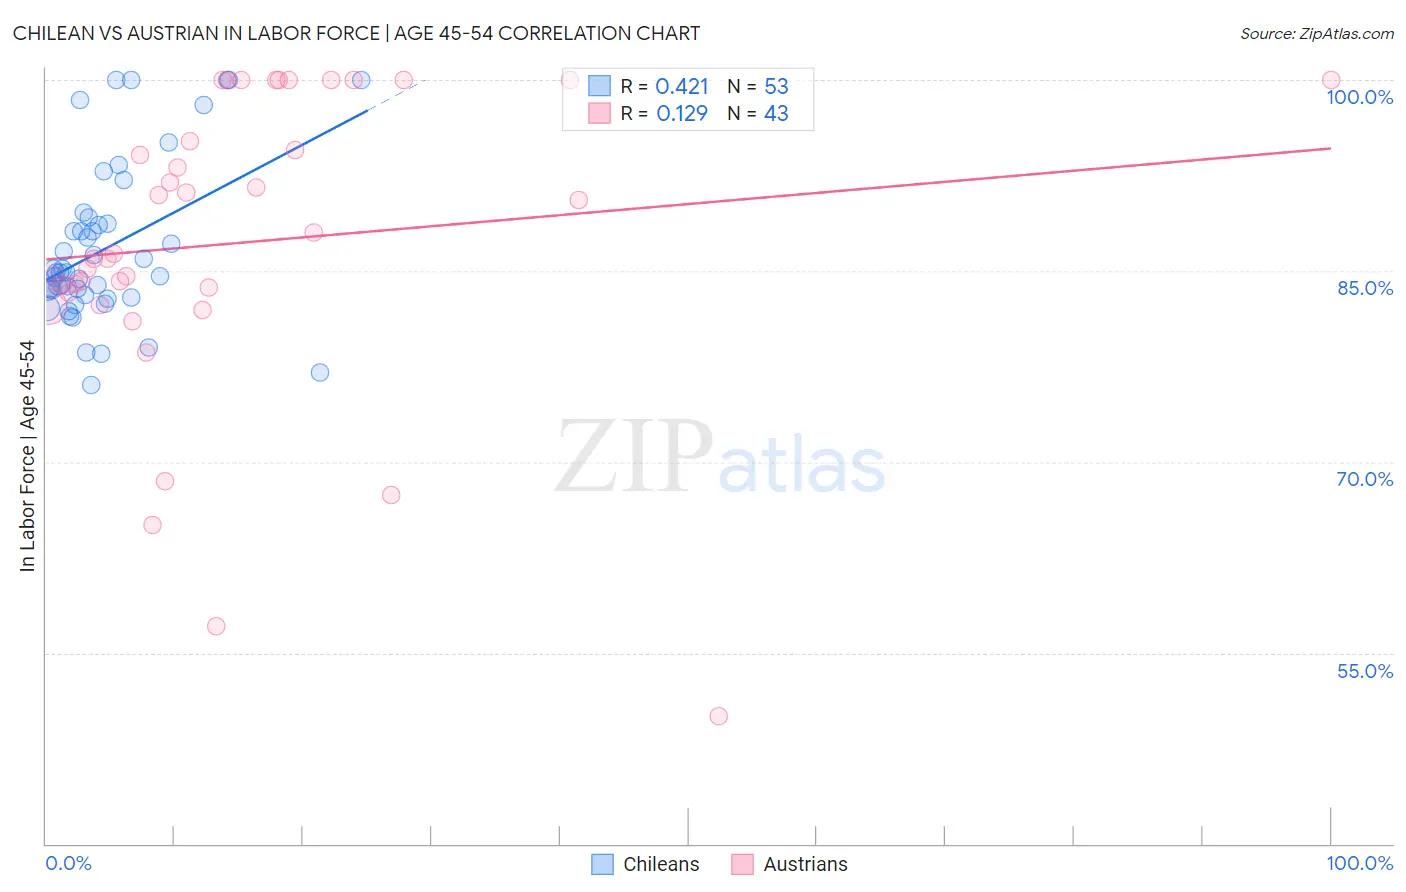
Chilean vs Austrian In Labor Force | Age 45-54 Correlation Chart
The statistical analysis conducted on geographies consisting of 256,549,165 people shows a moderate positive correlation between the proportion of Chileans and labor force participation rate among population between the ages 45 and 54 in the United States with a correlation coefficient (R) of 0.421 and weighted average of 83.4%. Similarly, the statistical analysis conducted on geographies consisting of 451,779,620 people shows a poor positive correlation between the proportion of Austrians and labor force participation rate among population between the ages 45 and 54 in the United States with a correlation coefficient (R) of 0.129 and weighted average of 83.0%, a difference of 0.50%.
In Labor Force | Age 45-54 Correlation Summary
| Measurement | Chilean | Austrian |
| Minimum | 76.0% | 50.0% |
| Maximum | 100.0% | 100.0% |
| Range | 24.0% | 50.0% |
| Mean | 86.8% | 87.2% |
| Median | 84.9% | 86.4% |
| Interquartile 25% (IQ1) | 83.0% | 83.3% |
| Interquartile 75% (IQ3) | 88.9% | 100.0% |
| Interquartile Range (IQR) | 5.9% | 16.7% |
| Standard Deviation (Sample) | 6.3% | 11.8% |
| Standard Deviation (Population) | 6.2% | 11.7% |
Similar Demographics by In Labor Force | Age 45-54
Demographics Similar to Chileans by In Labor Force | Age 45-54
In terms of in labor force | age 45-54, the demographic groups most similar to Chileans are Asian (83.4%, a difference of 0.0%), Egyptian (83.5%, a difference of 0.010%), Immigrants from Colombia (83.4%, a difference of 0.010%), Afghan (83.5%, a difference of 0.020%), and Immigrants from Kenya (83.5%, a difference of 0.020%).
| Demographics | Rating | Rank | In Labor Force | Age 45-54 |
| Carpatho Rusyns | 98.3 /100 | #60 | Exceptional 83.5% |
| Filipinos | 98.3 /100 | #61 | Exceptional 83.5% |
| Immigrants | Taiwan | 98.0 /100 | #62 | Exceptional 83.5% |
| Afghans | 97.9 /100 | #63 | Exceptional 83.5% |
| Immigrants | Kenya | 97.9 /100 | #64 | Exceptional 83.5% |
| Egyptians | 97.9 /100 | #65 | Exceptional 83.5% |
| Asians | 97.7 /100 | #66 | Exceptional 83.4% |
| Chileans | 97.7 /100 | #67 | Exceptional 83.4% |
| Immigrants | Colombia | 97.6 /100 | #68 | Exceptional 83.4% |
| Taiwanese | 97.5 /100 | #69 | Exceptional 83.4% |
| Immigrants | Latvia | 97.4 /100 | #70 | Exceptional 83.4% |
| Colombians | 97.3 /100 | #71 | Exceptional 83.4% |
| Serbians | 97.2 /100 | #72 | Exceptional 83.4% |
| Immigrants | Czechoslovakia | 97.1 /100 | #73 | Exceptional 83.4% |
| Immigrants | Somalia | 96.9 /100 | #74 | Exceptional 83.4% |
Demographics Similar to Austrians by In Labor Force | Age 45-54
In terms of in labor force | age 45-54, the demographic groups most similar to Austrians are Immigrants from Kazakhstan (83.0%, a difference of 0.0%), Sudanese (83.0%, a difference of 0.010%), Immigrants from Spain (83.0%, a difference of 0.010%), Liberian (83.0%, a difference of 0.020%), and Ghanaian (83.0%, a difference of 0.020%).
| Demographics | Rating | Rank | In Labor Force | Age 45-54 |
| Germans | 85.1 /100 | #128 | Excellent 83.1% |
| Immigrants | Northern Europe | 85.1 /100 | #129 | Excellent 83.1% |
| Immigrants | Israel | 84.7 /100 | #130 | Excellent 83.1% |
| Finns | 83.3 /100 | #131 | Excellent 83.1% |
| Immigrants | Ukraine | 82.9 /100 | #132 | Excellent 83.0% |
| Liberians | 82.7 /100 | #133 | Excellent 83.0% |
| Sudanese | 82.0 /100 | #134 | Excellent 83.0% |
| Austrians | 81.3 /100 | #135 | Excellent 83.0% |
| Immigrants | Kazakhstan | 81.0 /100 | #136 | Excellent 83.0% |
| Immigrants | Spain | 80.4 /100 | #137 | Excellent 83.0% |
| Ghanaians | 79.5 /100 | #138 | Good 83.0% |
| Scandinavians | 78.5 /100 | #139 | Good 83.0% |
| Yugoslavians | 78.3 /100 | #140 | Good 83.0% |
| Immigrants | Haiti | 77.9 /100 | #141 | Good 83.0% |
| Immigrants | Scotland | 77.8 /100 | #142 | Good 83.0% |