Cheyenne vs Immigrants from Latvia 1st Grade
COMPARE
Cheyenne
Immigrants from Latvia
1st Grade
1st Grade Comparison
Cheyenne
Immigrants from Latvia
98.3%
1ST GRADE
99.6/ 100
METRIC RATING
72nd/ 347
METRIC RANK
98.2%
1ST GRADE
96.4/ 100
METRIC RATING
113th/ 347
METRIC RANK
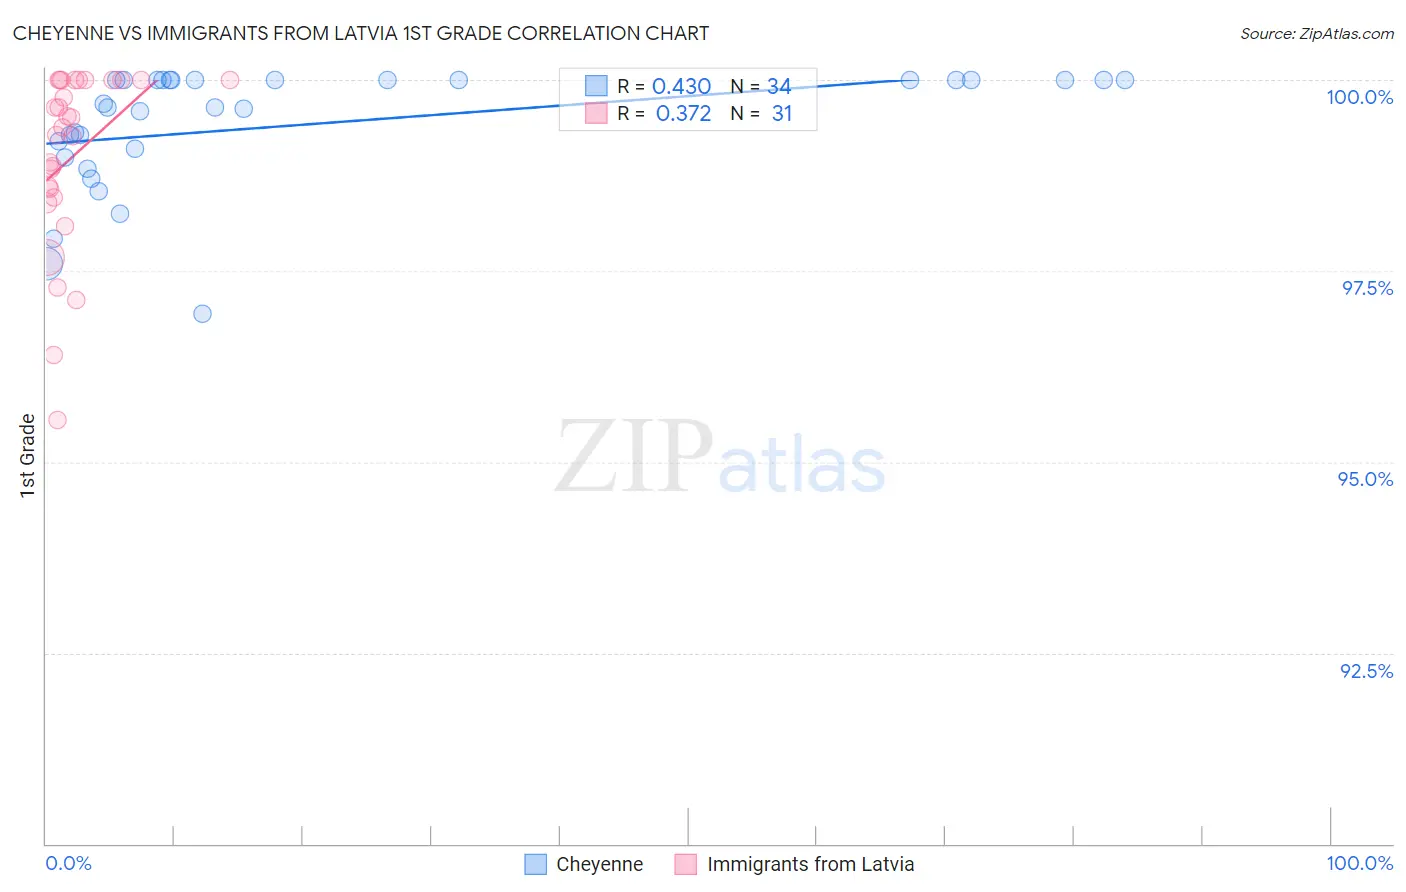
Cheyenne vs Immigrants from Latvia 1st Grade Correlation Chart
The statistical analysis conducted on geographies consisting of 80,719,411 people shows a moderate positive correlation between the proportion of Cheyenne and percentage of population with at least 1st grade education in the United States with a correlation coefficient (R) of 0.430 and weighted average of 98.3%. Similarly, the statistical analysis conducted on geographies consisting of 113,735,345 people shows a mild positive correlation between the proportion of Immigrants from Latvia and percentage of population with at least 1st grade education in the United States with a correlation coefficient (R) of 0.372 and weighted average of 98.2%, a difference of 0.17%.
1st Grade Correlation Summary
| Measurement | Cheyenne | Immigrants from Latvia |
| Minimum | 96.9% | 95.5% |
| Maximum | 100.0% | 100.0% |
| Range | 3.1% | 4.5% |
| Mean | 99.4% | 99.0% |
| Median | 99.7% | 99.4% |
| Interquartile 25% (IQ1) | 99.1% | 98.5% |
| Interquartile 75% (IQ3) | 100.0% | 100.0% |
| Interquartile Range (IQR) | 0.90% | 1.5% |
| Standard Deviation (Sample) | 0.79% | 1.2% |
| Standard Deviation (Population) | 0.78% | 1.2% |
Similar Demographics by 1st Grade
Demographics Similar to Cheyenne by 1st Grade
In terms of 1st grade, the demographic groups most similar to Cheyenne are Canadian (98.3%, a difference of 0.010%), Immigrants from Austria (98.3%, a difference of 0.010%), Immigrants from Northern Europe (98.3%, a difference of 0.010%), Chickasaw (98.3%, a difference of 0.010%), and Russian (98.3%, a difference of 0.010%).
| Demographics | Rating | Rank | 1st Grade |
| Maltese | 99.7 /100 | #65 | Exceptional 98.4% |
| Canadians | 99.6 /100 | #66 | Exceptional 98.3% |
| Immigrants | Austria | 99.6 /100 | #67 | Exceptional 98.3% |
| Immigrants | Northern Europe | 99.6 /100 | #68 | Exceptional 98.3% |
| Chickasaw | 99.6 /100 | #69 | Exceptional 98.3% |
| Russians | 99.6 /100 | #70 | Exceptional 98.3% |
| Serbians | 99.6 /100 | #71 | Exceptional 98.3% |
| Cheyenne | 99.6 /100 | #72 | Exceptional 98.3% |
| Cajuns | 99.5 /100 | #73 | Exceptional 98.3% |
| Immigrants | Netherlands | 99.4 /100 | #74 | Exceptional 98.3% |
| Cherokee | 99.3 /100 | #75 | Exceptional 98.3% |
| Shoshone | 99.3 /100 | #76 | Exceptional 98.3% |
| Immigrants | England | 99.3 /100 | #77 | Exceptional 98.3% |
| Immigrants | Belgium | 99.2 /100 | #78 | Exceptional 98.3% |
| Immigrants | Lithuania | 99.2 /100 | #79 | Exceptional 98.3% |
Demographics Similar to Immigrants from Latvia by 1st Grade
In terms of 1st grade, the demographic groups most similar to Immigrants from Latvia are Immigrants from Norway (98.2%, a difference of 0.0%), Ute (98.2%, a difference of 0.0%), Immigrants from Singapore (98.2%, a difference of 0.010%), Immigrants from Czechoslovakia (98.2%, a difference of 0.010%), and Iranian (98.2%, a difference of 0.010%).
| Demographics | Rating | Rank | 1st Grade |
| Turks | 97.4 /100 | #106 | Exceptional 98.2% |
| Immigrants | Switzerland | 97.3 /100 | #107 | Exceptional 98.2% |
| Bhutanese | 97.3 /100 | #108 | Exceptional 98.2% |
| German Russians | 97.1 /100 | #109 | Exceptional 98.2% |
| Immigrants | Singapore | 96.7 /100 | #110 | Exceptional 98.2% |
| Immigrants | Czechoslovakia | 96.6 /100 | #111 | Exceptional 98.2% |
| Immigrants | Norway | 96.6 /100 | #112 | Exceptional 98.2% |
| Immigrants | Latvia | 96.4 /100 | #113 | Exceptional 98.2% |
| Ute | 96.2 /100 | #114 | Exceptional 98.2% |
| Iranians | 96.0 /100 | #115 | Exceptional 98.2% |
| Spanish | 95.9 /100 | #116 | Exceptional 98.2% |
| Yugoslavians | 95.5 /100 | #117 | Exceptional 98.2% |
| Immigrants | France | 95.5 /100 | #118 | Exceptional 98.2% |
| Thais | 94.7 /100 | #119 | Exceptional 98.1% |
| Okinawans | 94.5 /100 | #120 | Exceptional 98.1% |