Cheyenne vs Immigrants from Ethiopia 4th Grade
COMPARE
Cheyenne
Immigrants from Ethiopia
4th Grade
4th Grade Comparison
Cheyenne
Immigrants from Ethiopia
97.9%
4TH GRADE
98.4/ 100
METRIC RATING
97th/ 347
METRIC RANK
97.0%
4TH GRADE
0.4/ 100
METRIC RATING
259th/ 347
METRIC RANK
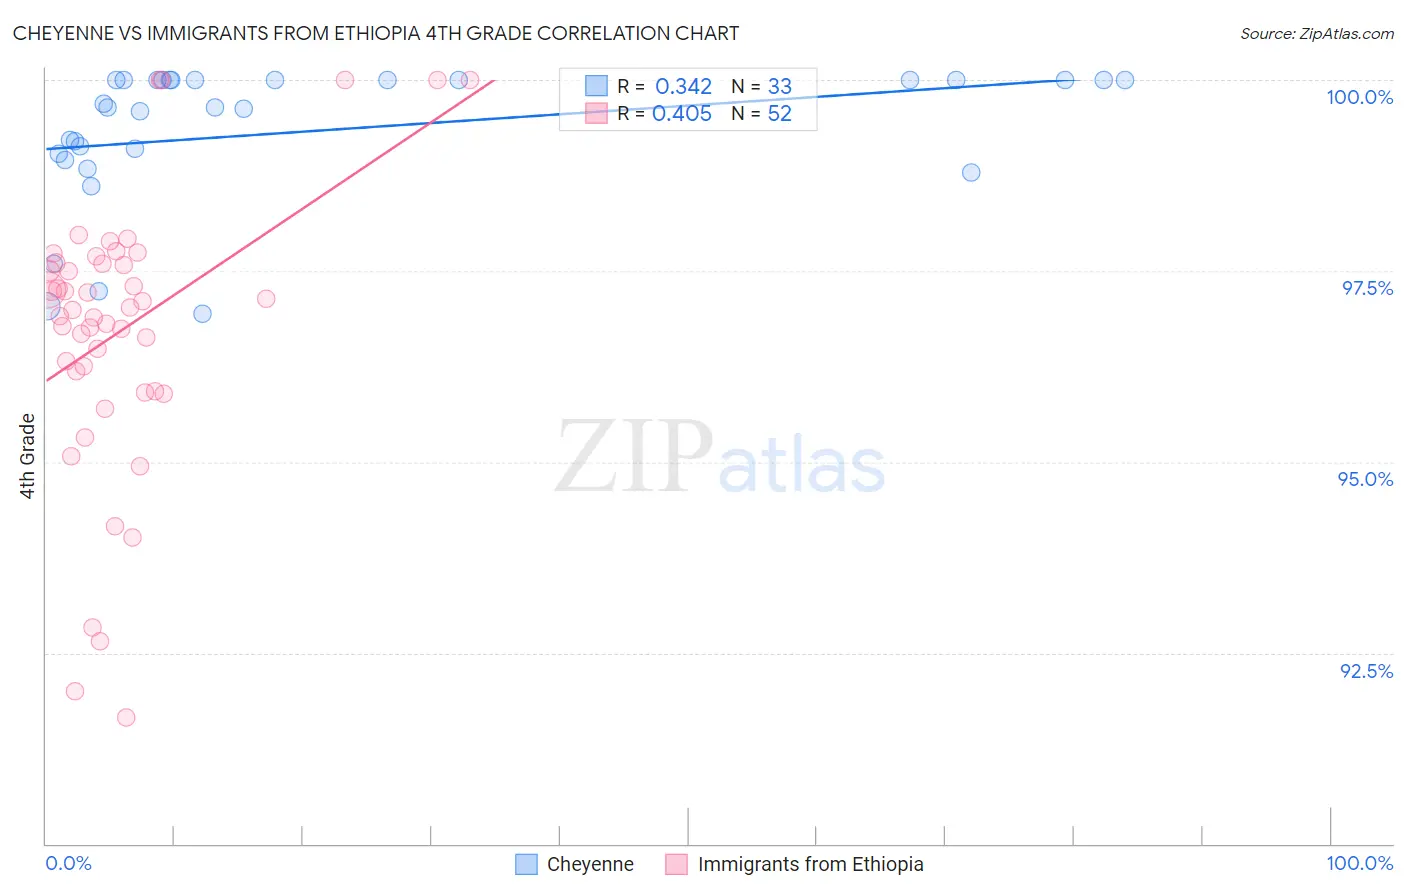
Cheyenne vs Immigrants from Ethiopia 4th Grade Correlation Chart
The statistical analysis conducted on geographies consisting of 80,716,760 people shows a mild positive correlation between the proportion of Cheyenne and percentage of population with at least 4th grade education in the United States with a correlation coefficient (R) of 0.342 and weighted average of 97.9%. Similarly, the statistical analysis conducted on geographies consisting of 211,514,076 people shows a moderate positive correlation between the proportion of Immigrants from Ethiopia and percentage of population with at least 4th grade education in the United States with a correlation coefficient (R) of 0.405 and weighted average of 97.0%, a difference of 0.91%.
4th Grade Correlation Summary
| Measurement | Cheyenne | Immigrants from Ethiopia |
| Minimum | 96.9% | 91.7% |
| Maximum | 100.0% | 100.0% |
| Range | 3.1% | 8.3% |
| Mean | 99.3% | 96.7% |
| Median | 99.6% | 97.0% |
| Interquartile 25% (IQ1) | 99.0% | 96.1% |
| Interquartile 75% (IQ3) | 100.0% | 97.6% |
| Interquartile Range (IQR) | 1.0% | 1.5% |
| Standard Deviation (Sample) | 0.92% | 1.8% |
| Standard Deviation (Population) | 0.90% | 1.8% |
Similar Demographics by 4th Grade
Demographics Similar to Cheyenne by 4th Grade
In terms of 4th grade, the demographic groups most similar to Cheyenne are Romanian (97.9%, a difference of 0.0%), Immigrants from Germany (97.9%, a difference of 0.010%), South African (97.9%, a difference of 0.010%), Turkish (97.9%, a difference of 0.010%), and Yugoslavian (97.9%, a difference of 0.010%).
| Demographics | Rating | Rank | 4th Grade |
| Immigrants | Denmark | 98.7 /100 | #90 | Exceptional 97.9% |
| Immigrants | Sweden | 98.7 /100 | #91 | Exceptional 97.9% |
| Immigrants | Western Europe | 98.7 /100 | #92 | Exceptional 97.9% |
| Immigrants | Ireland | 98.7 /100 | #93 | Exceptional 97.9% |
| Shoshone | 98.7 /100 | #94 | Exceptional 97.9% |
| Immigrants | Germany | 98.5 /100 | #95 | Exceptional 97.9% |
| Romanians | 98.4 /100 | #96 | Exceptional 97.9% |
| Cheyenne | 98.4 /100 | #97 | Exceptional 97.9% |
| South Africans | 98.2 /100 | #98 | Exceptional 97.9% |
| Turks | 98.2 /100 | #99 | Exceptional 97.9% |
| Yugoslavians | 98.1 /100 | #100 | Exceptional 97.9% |
| Cree | 98.1 /100 | #101 | Exceptional 97.9% |
| Choctaw | 97.9 /100 | #102 | Exceptional 97.9% |
| Puget Sound Salish | 97.7 /100 | #103 | Exceptional 97.9% |
| Immigrants | Nonimmigrants | 97.5 /100 | #104 | Exceptional 97.9% |
Demographics Similar to Immigrants from Ethiopia by 4th Grade
In terms of 4th grade, the demographic groups most similar to Immigrants from Ethiopia are Immigrants from Congo (97.0%, a difference of 0.010%), Immigrants from Colombia (97.0%, a difference of 0.010%), Immigrants from Sierra Leone (97.0%, a difference of 0.010%), Immigrants from South America (97.0%, a difference of 0.020%), and West Indian (97.0%, a difference of 0.020%).
| Demographics | Rating | Rank | 4th Grade |
| Jamaicans | 0.8 /100 | #252 | Tragic 97.1% |
| Immigrants | Liberia | 0.8 /100 | #253 | Tragic 97.1% |
| Immigrants | Middle Africa | 0.8 /100 | #254 | Tragic 97.1% |
| Peruvians | 0.7 /100 | #255 | Tragic 97.1% |
| Bolivians | 0.7 /100 | #256 | Tragic 97.1% |
| Immigrants | Congo | 0.5 /100 | #257 | Tragic 97.0% |
| Immigrants | Colombia | 0.5 /100 | #258 | Tragic 97.0% |
| Immigrants | Ethiopia | 0.4 /100 | #259 | Tragic 97.0% |
| Immigrants | Sierra Leone | 0.4 /100 | #260 | Tragic 97.0% |
| Immigrants | South America | 0.4 /100 | #261 | Tragic 97.0% |
| West Indians | 0.4 /100 | #262 | Tragic 97.0% |
| Immigrants | Jamaica | 0.3 /100 | #263 | Tragic 97.0% |
| Taiwanese | 0.3 /100 | #264 | Tragic 97.0% |
| Armenians | 0.3 /100 | #265 | Tragic 97.0% |
| Immigrants | China | 0.3 /100 | #266 | Tragic 97.0% |