Cheyenne vs Nigerian In Labor Force | Age 30-34
COMPARE
Cheyenne
Nigerian
In Labor Force | Age 30-34
In Labor Force | Age 30-34 Comparison
Cheyenne
Nigerians
81.1%
IN LABOR FORCE | AGE 30-34
0.0/ 100
METRIC RATING
324th/ 347
METRIC RANK
84.5%
IN LABOR FORCE | AGE 30-34
28.9/ 100
METRIC RATING
189th/ 347
METRIC RANK
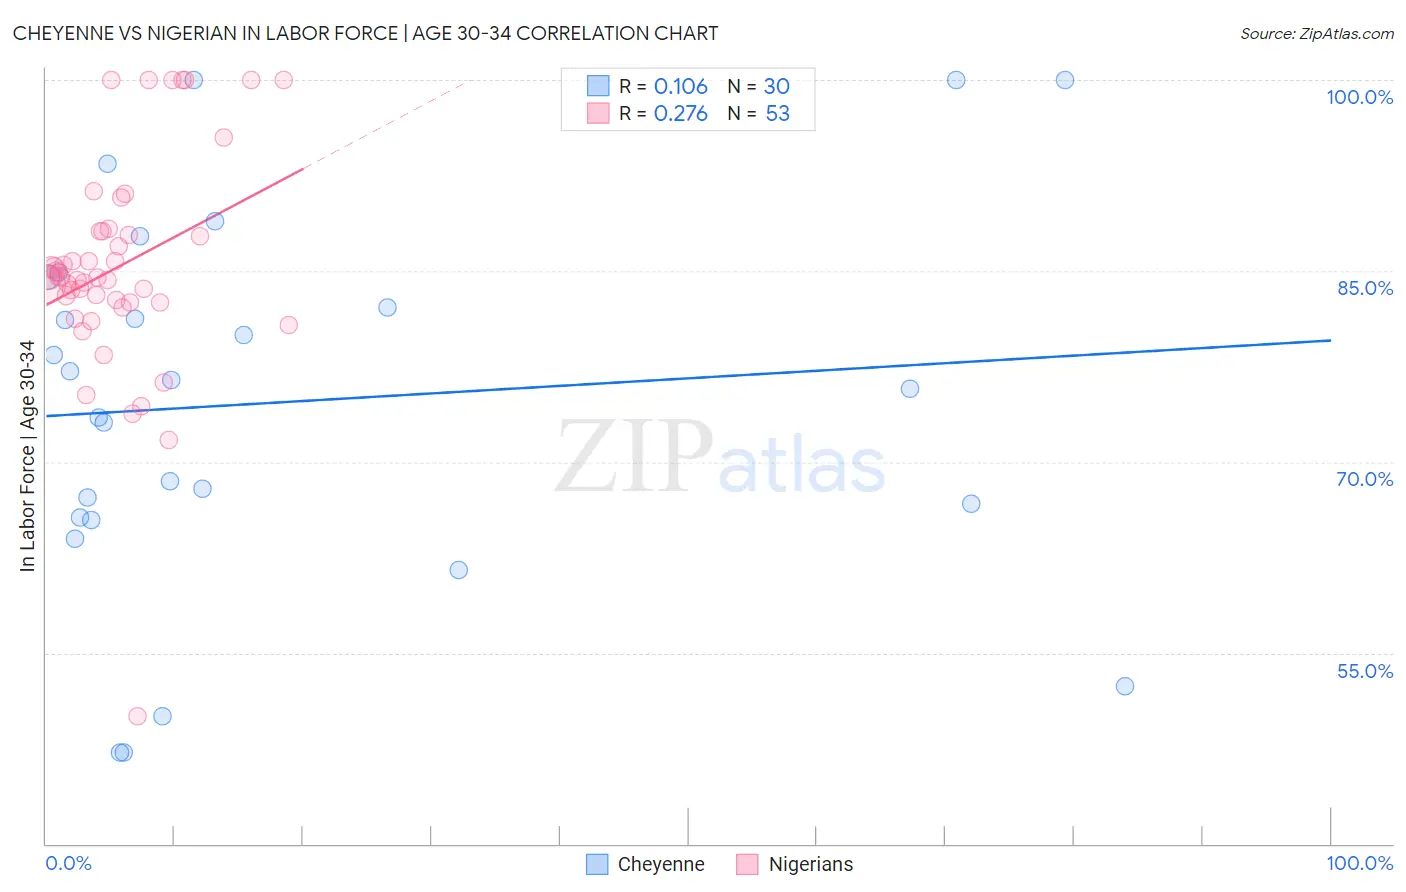
Cheyenne vs Nigerian In Labor Force | Age 30-34 Correlation Chart
The statistical analysis conducted on geographies consisting of 80,694,830 people shows a poor positive correlation between the proportion of Cheyenne and labor force participation rate among population between the ages 30 and 34 in the United States with a correlation coefficient (R) of 0.106 and weighted average of 81.1%. Similarly, the statistical analysis conducted on geographies consisting of 332,575,252 people shows a weak positive correlation between the proportion of Nigerians and labor force participation rate among population between the ages 30 and 34 in the United States with a correlation coefficient (R) of 0.276 and weighted average of 84.5%, a difference of 4.2%.
In Labor Force | Age 30-34 Correlation Summary
| Measurement | Cheyenne | Nigerian |
| Minimum | 47.1% | 50.0% |
| Maximum | 100.0% | 100.0% |
| Range | 52.9% | 50.0% |
| Mean | 74.7% | 85.3% |
| Median | 76.0% | 84.5% |
| Interquartile 25% (IQ1) | 65.6% | 82.5% |
| Interquartile 75% (IQ3) | 84.5% | 88.1% |
| Interquartile Range (IQR) | 18.9% | 5.6% |
| Standard Deviation (Sample) | 14.8% | 8.6% |
| Standard Deviation (Population) | 14.5% | 8.5% |
Similar Demographics by In Labor Force | Age 30-34
Demographics Similar to Cheyenne by In Labor Force | Age 30-34
In terms of in labor force | age 30-34, the demographic groups most similar to Cheyenne are Paiute (81.2%, a difference of 0.030%), Puerto Rican (81.2%, a difference of 0.080%), Dutch West Indian (81.0%, a difference of 0.15%), Alaska Native (81.3%, a difference of 0.24%), and Yaqui (81.4%, a difference of 0.32%).
| Demographics | Rating | Rank | In Labor Force | Age 30-34 |
| Arapaho | 0.0 /100 | #317 | Tragic 81.5% |
| Choctaw | 0.0 /100 | #318 | Tragic 81.4% |
| Shoshone | 0.0 /100 | #319 | Tragic 81.4% |
| Yaqui | 0.0 /100 | #320 | Tragic 81.4% |
| Alaska Natives | 0.0 /100 | #321 | Tragic 81.3% |
| Puerto Ricans | 0.0 /100 | #322 | Tragic 81.2% |
| Paiute | 0.0 /100 | #323 | Tragic 81.2% |
| Cheyenne | 0.0 /100 | #324 | Tragic 81.1% |
| Dutch West Indians | 0.0 /100 | #325 | Tragic 81.0% |
| Seminole | 0.0 /100 | #326 | Tragic 80.8% |
| Colville | 0.0 /100 | #327 | Tragic 80.7% |
| Sioux | 0.0 /100 | #328 | Tragic 80.4% |
| Creek | 0.0 /100 | #329 | Tragic 80.4% |
| Pueblo | 0.0 /100 | #330 | Tragic 80.0% |
| Houma | 0.0 /100 | #331 | Tragic 79.9% |
Demographics Similar to Nigerians by In Labor Force | Age 30-34
In terms of in labor force | age 30-34, the demographic groups most similar to Nigerians are Taiwanese (84.6%, a difference of 0.0%), Immigrants from Congo (84.6%, a difference of 0.010%), Costa Rican (84.6%, a difference of 0.010%), Immigrants from Philippines (84.6%, a difference of 0.020%), and Immigrants from Zaire (84.5%, a difference of 0.030%).
| Demographics | Rating | Rank | In Labor Force | Age 30-34 |
| Barbadians | 36.7 /100 | #182 | Fair 84.6% |
| Immigrants | Canada | 35.0 /100 | #183 | Fair 84.6% |
| Immigrants | North America | 33.3 /100 | #184 | Fair 84.6% |
| Immigrants | Philippines | 31.5 /100 | #185 | Fair 84.6% |
| Immigrants | Congo | 29.7 /100 | #186 | Fair 84.6% |
| Costa Ricans | 29.6 /100 | #187 | Fair 84.6% |
| Taiwanese | 29.4 /100 | #188 | Fair 84.6% |
| Nigerians | 28.9 /100 | #189 | Fair 84.5% |
| Immigrants | Zaire | 25.8 /100 | #190 | Fair 84.5% |
| Hungarians | 24.8 /100 | #191 | Fair 84.5% |
| Scandinavians | 24.7 /100 | #192 | Fair 84.5% |
| Immigrants | Costa Rica | 23.9 /100 | #193 | Fair 84.5% |
| Immigrants | Afghanistan | 23.5 /100 | #194 | Fair 84.5% |
| Koreans | 23.2 /100 | #195 | Fair 84.5% |
| British | 22.9 /100 | #196 | Fair 84.5% |