Celtic vs British In Labor Force | Age 30-34
COMPARE
Celtic
British
In Labor Force | Age 30-34
In Labor Force | Age 30-34 Comparison
Celtics
British
84.1%
IN LABOR FORCE | AGE 30-34
1.4/ 100
METRIC RATING
237th/ 347
METRIC RANK
84.5%
IN LABOR FORCE | AGE 30-34
22.9/ 100
METRIC RATING
196th/ 347
METRIC RANK
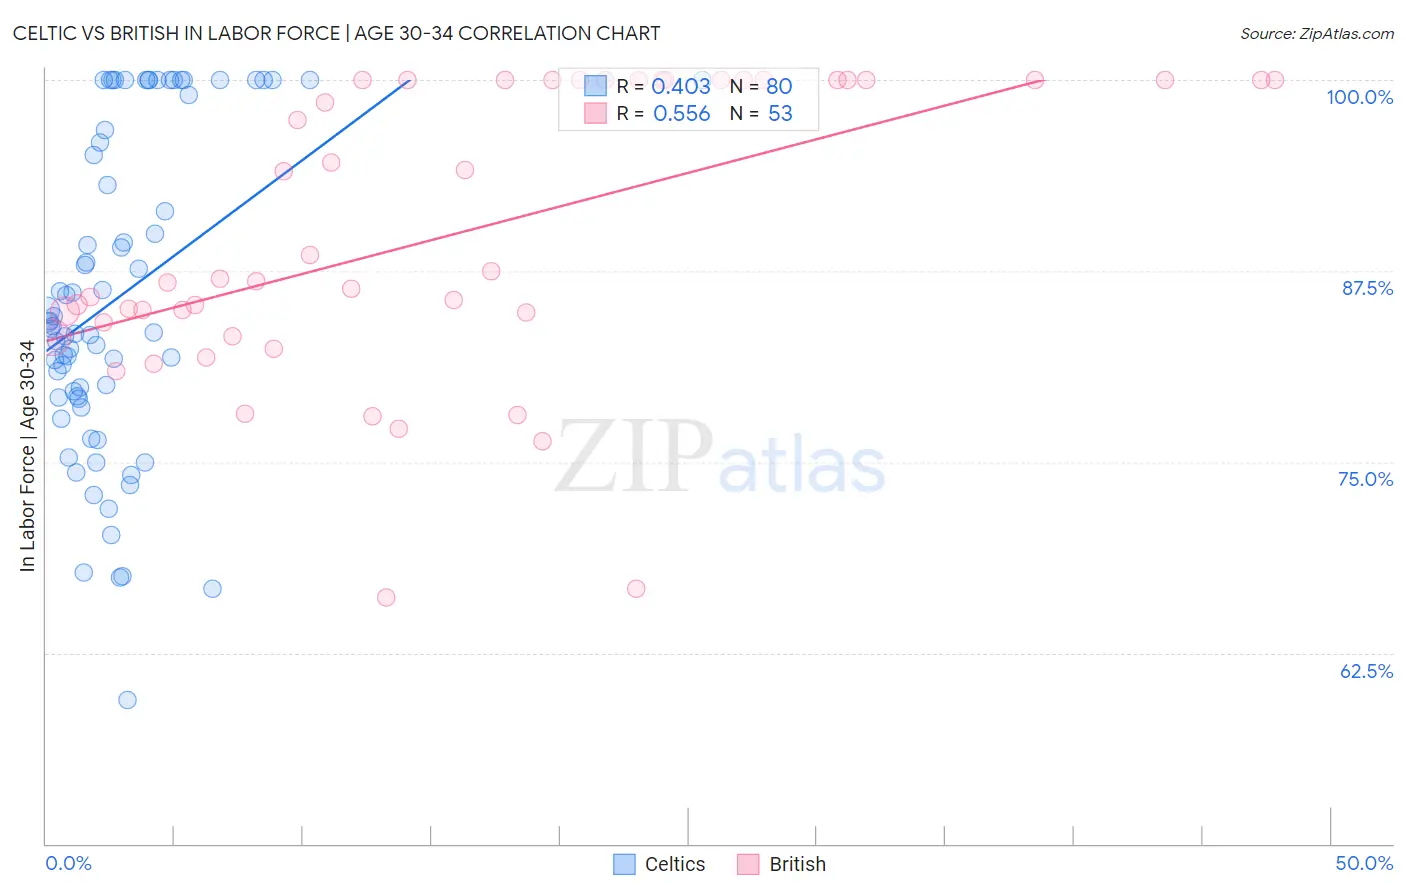
Celtic vs British In Labor Force | Age 30-34 Correlation Chart
The statistical analysis conducted on geographies consisting of 168,853,097 people shows a moderate positive correlation between the proportion of Celtics and labor force participation rate among population between the ages 30 and 34 in the United States with a correlation coefficient (R) of 0.403 and weighted average of 84.1%. Similarly, the statistical analysis conducted on geographies consisting of 530,789,592 people shows a substantial positive correlation between the proportion of British and labor force participation rate among population between the ages 30 and 34 in the United States with a correlation coefficient (R) of 0.556 and weighted average of 84.5%, a difference of 0.54%.
In Labor Force | Age 30-34 Correlation Summary
| Measurement | Celtic | British |
| Minimum | 59.4% | 66.1% |
| Maximum | 100.0% | 100.0% |
| Range | 40.6% | 33.9% |
| Mean | 85.9% | 89.9% |
| Median | 84.0% | 87.0% |
| Interquartile 25% (IQ1) | 79.3% | 83.7% |
| Interquartile 75% (IQ3) | 97.8% | 100.0% |
| Interquartile Range (IQR) | 18.6% | 16.3% |
| Standard Deviation (Sample) | 10.4% | 9.4% |
| Standard Deviation (Population) | 10.4% | 9.4% |
Similar Demographics by In Labor Force | Age 30-34
Demographics Similar to Celtics by In Labor Force | Age 30-34
In terms of in labor force | age 30-34, the demographic groups most similar to Celtics are Immigrants from Barbados (84.0%, a difference of 0.0%), U.S. Virgin Islander (84.1%, a difference of 0.010%), English (84.0%, a difference of 0.010%), Venezuelan (84.0%, a difference of 0.010%), and French American Indian (84.1%, a difference of 0.030%).
| Demographics | Rating | Rank | In Labor Force | Age 30-34 |
| Immigrants | Bahamas | 2.6 /100 | #230 | Tragic 84.1% |
| Malaysians | 2.2 /100 | #231 | Tragic 84.1% |
| Immigrants | Immigrants | 2.0 /100 | #232 | Tragic 84.1% |
| West Indians | 1.9 /100 | #233 | Tragic 84.1% |
| Haitians | 1.8 /100 | #234 | Tragic 84.1% |
| French American Indians | 1.7 /100 | #235 | Tragic 84.1% |
| U.S. Virgin Islanders | 1.5 /100 | #236 | Tragic 84.1% |
| Celtics | 1.4 /100 | #237 | Tragic 84.1% |
| Immigrants | Barbados | 1.4 /100 | #238 | Tragic 84.0% |
| English | 1.4 /100 | #239 | Tragic 84.0% |
| Venezuelans | 1.3 /100 | #240 | Tragic 84.0% |
| Immigrants | Portugal | 1.2 /100 | #241 | Tragic 84.0% |
| Immigrants | Oceania | 1.1 /100 | #242 | Tragic 84.0% |
| Immigrants | Caribbean | 1.1 /100 | #243 | Tragic 84.0% |
| Basques | 0.9 /100 | #244 | Tragic 84.0% |
Demographics Similar to British by In Labor Force | Age 30-34
In terms of in labor force | age 30-34, the demographic groups most similar to British are Korean (84.5%, a difference of 0.0%), Immigrants from Costa Rica (84.5%, a difference of 0.010%), Immigrants from Afghanistan (84.5%, a difference of 0.010%), Immigrants from Syria (84.5%, a difference of 0.010%), and Hungarian (84.5%, a difference of 0.020%).
| Demographics | Rating | Rank | In Labor Force | Age 30-34 |
| Nigerians | 28.9 /100 | #189 | Fair 84.5% |
| Immigrants | Zaire | 25.8 /100 | #190 | Fair 84.5% |
| Hungarians | 24.8 /100 | #191 | Fair 84.5% |
| Scandinavians | 24.7 /100 | #192 | Fair 84.5% |
| Immigrants | Costa Rica | 23.9 /100 | #193 | Fair 84.5% |
| Immigrants | Afghanistan | 23.5 /100 | #194 | Fair 84.5% |
| Koreans | 23.2 /100 | #195 | Fair 84.5% |
| British | 22.9 /100 | #196 | Fair 84.5% |
| Immigrants | Syria | 21.9 /100 | #197 | Fair 84.5% |
| Dutch | 20.2 /100 | #198 | Fair 84.5% |
| Immigrants | Thailand | 19.1 /100 | #199 | Poor 84.5% |
| Sub-Saharan Africans | 19.0 /100 | #200 | Poor 84.5% |
| Trinidadians and Tobagonians | 18.2 /100 | #201 | Poor 84.5% |
| Immigrants | West Indies | 18.1 /100 | #202 | Poor 84.5% |
| Canadians | 15.4 /100 | #203 | Poor 84.4% |