Carpatho Rusyn vs Luxembourger In Labor Force | Age 45-54
COMPARE
Carpatho Rusyn
Luxembourger
In Labor Force | Age 45-54
In Labor Force | Age 45-54 Comparison
Carpatho Rusyns
Luxembourgers
83.5%
IN LABOR FORCE | AGE 45-54
98.3/ 100
METRIC RATING
60th/ 347
METRIC RANK
85.0%
IN LABOR FORCE | AGE 45-54
100.0/ 100
METRIC RATING
2nd/ 347
METRIC RANK
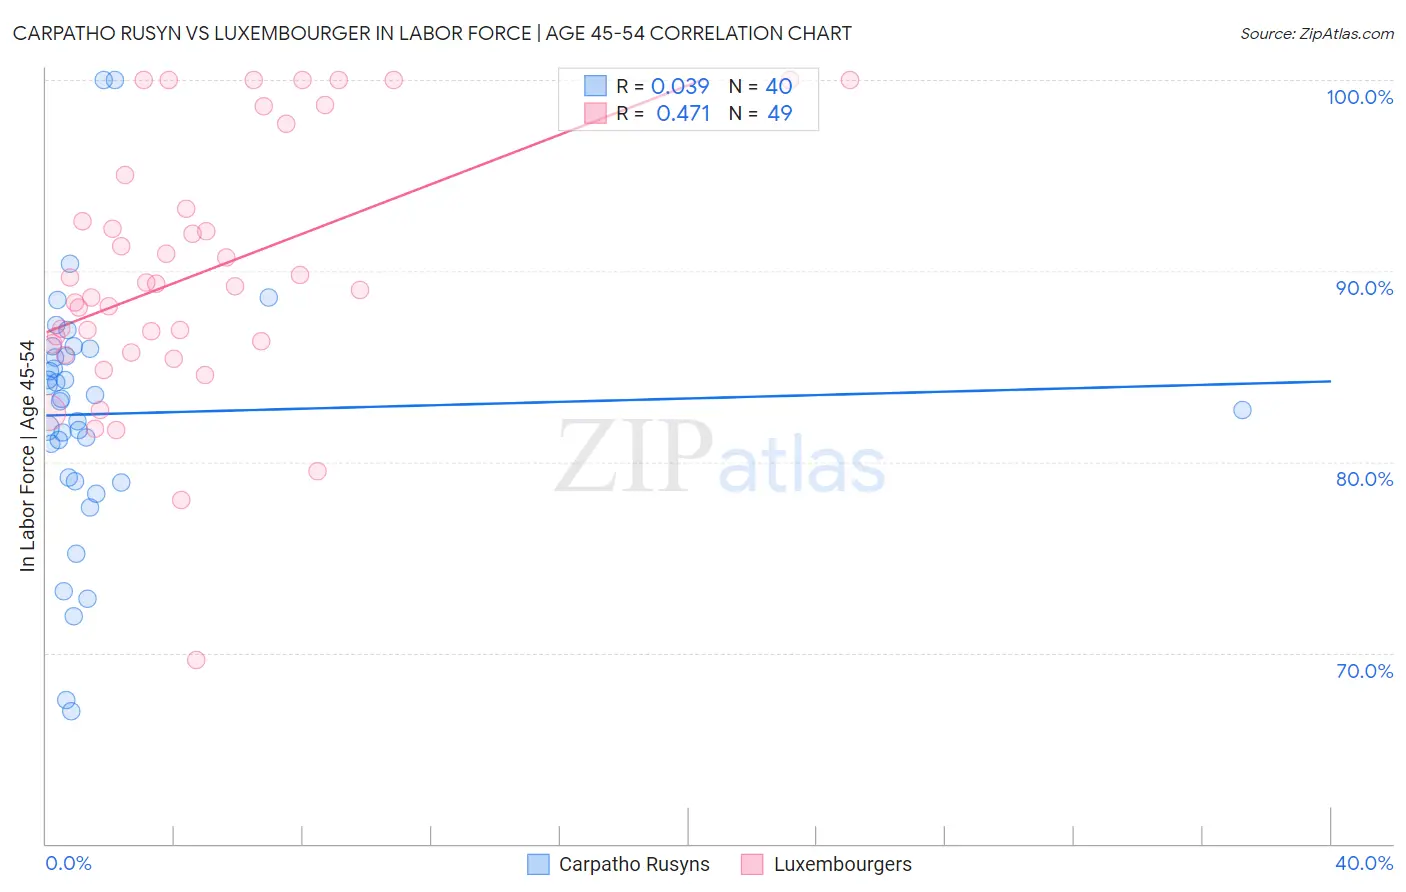
Carpatho Rusyn vs Luxembourger In Labor Force | Age 45-54 Correlation Chart
The statistical analysis conducted on geographies consisting of 58,870,959 people shows no correlation between the proportion of Carpatho Rusyns and labor force participation rate among population between the ages 45 and 54 in the United States with a correlation coefficient (R) of 0.039 and weighted average of 83.5%. Similarly, the statistical analysis conducted on geographies consisting of 144,640,644 people shows a moderate positive correlation between the proportion of Luxembourgers and labor force participation rate among population between the ages 45 and 54 in the United States with a correlation coefficient (R) of 0.471 and weighted average of 85.0%, a difference of 1.8%.
In Labor Force | Age 45-54 Correlation Summary
| Measurement | Carpatho Rusyn | Luxembourger |
| Minimum | 66.9% | 69.6% |
| Maximum | 100.0% | 100.0% |
| Range | 33.1% | 30.4% |
| Mean | 82.5% | 89.9% |
| Median | 83.2% | 89.2% |
| Interquartile 25% (IQ1) | 79.1% | 85.9% |
| Interquartile 75% (IQ3) | 85.7% | 94.1% |
| Interquartile Range (IQR) | 6.6% | 8.2% |
| Standard Deviation (Sample) | 6.7% | 6.8% |
| Standard Deviation (Population) | 6.6% | 6.7% |
Similar Demographics by In Labor Force | Age 45-54
Demographics Similar to Carpatho Rusyns by In Labor Force | Age 45-54
In terms of in labor force | age 45-54, the demographic groups most similar to Carpatho Rusyns are Bhutanese (83.5%, a difference of 0.0%), Filipino (83.5%, a difference of 0.0%), Eastern European (83.5%, a difference of 0.020%), Paraguayan (83.5%, a difference of 0.030%), and Immigrants from Taiwan (83.5%, a difference of 0.030%).
| Demographics | Rating | Rank | In Labor Force | Age 45-54 |
| Peruvians | 98.7 /100 | #53 | Exceptional 83.6% |
| Somalis | 98.7 /100 | #54 | Exceptional 83.5% |
| Macedonians | 98.7 /100 | #55 | Exceptional 83.5% |
| Immigrants | Peru | 98.6 /100 | #56 | Exceptional 83.5% |
| Paraguayans | 98.5 /100 | #57 | Exceptional 83.5% |
| Eastern Europeans | 98.5 /100 | #58 | Exceptional 83.5% |
| Bhutanese | 98.3 /100 | #59 | Exceptional 83.5% |
| Carpatho Rusyns | 98.3 /100 | #60 | Exceptional 83.5% |
| Filipinos | 98.3 /100 | #61 | Exceptional 83.5% |
| Immigrants | Taiwan | 98.0 /100 | #62 | Exceptional 83.5% |
| Afghans | 97.9 /100 | #63 | Exceptional 83.5% |
| Immigrants | Kenya | 97.9 /100 | #64 | Exceptional 83.5% |
| Egyptians | 97.9 /100 | #65 | Exceptional 83.5% |
| Asians | 97.7 /100 | #66 | Exceptional 83.4% |
| Chileans | 97.7 /100 | #67 | Exceptional 83.4% |
Demographics Similar to Luxembourgers by In Labor Force | Age 45-54
In terms of in labor force | age 45-54, the demographic groups most similar to Luxembourgers are Bolivian (84.9%, a difference of 0.090%), Immigrants from Ethiopia (84.8%, a difference of 0.21%), Ethiopian (84.8%, a difference of 0.29%), Immigrants from Bolivia (85.3%, a difference of 0.34%), and Immigrants from India (84.7%, a difference of 0.40%).
| Demographics | Rating | Rank | In Labor Force | Age 45-54 |
| Immigrants | Bolivia | 100.0 /100 | #1 | Exceptional 85.3% |
| Luxembourgers | 100.0 /100 | #2 | Exceptional 85.0% |
| Bolivians | 100.0 /100 | #3 | Exceptional 84.9% |
| Immigrants | Ethiopia | 100.0 /100 | #4 | Exceptional 84.8% |
| Ethiopians | 100.0 /100 | #5 | Exceptional 84.8% |
| Immigrants | India | 100.0 /100 | #6 | Exceptional 84.7% |
| Immigrants | Cameroon | 100.0 /100 | #7 | Exceptional 84.6% |
| Sierra Leoneans | 100.0 /100 | #8 | Exceptional 84.5% |
| Immigrants | Sierra Leone | 100.0 /100 | #9 | Exceptional 84.4% |
| Norwegians | 100.0 /100 | #10 | Exceptional 84.4% |
| Thais | 100.0 /100 | #11 | Exceptional 84.3% |
| Bulgarians | 100.0 /100 | #12 | Exceptional 84.2% |
| Chinese | 99.9 /100 | #13 | Exceptional 84.1% |
| Cambodians | 99.9 /100 | #14 | Exceptional 84.1% |
| Cypriots | 99.9 /100 | #15 | Exceptional 84.1% |