Cape Verdean vs Immigrants from Belgium In Labor Force | Age 16-19
COMPARE
Cape Verdean
Immigrants from Belgium
In Labor Force | Age 16-19
In Labor Force | Age 16-19 Comparison
Cape Verdeans
Immigrants from Belgium
44.5%
IN LABOR FORCE | AGE 16-19
100.0/ 100
METRIC RATING
9th/ 347
METRIC RANK
35.3%
IN LABOR FORCE | AGE 16-19
6.1/ 100
METRIC RATING
225th/ 347
METRIC RANK
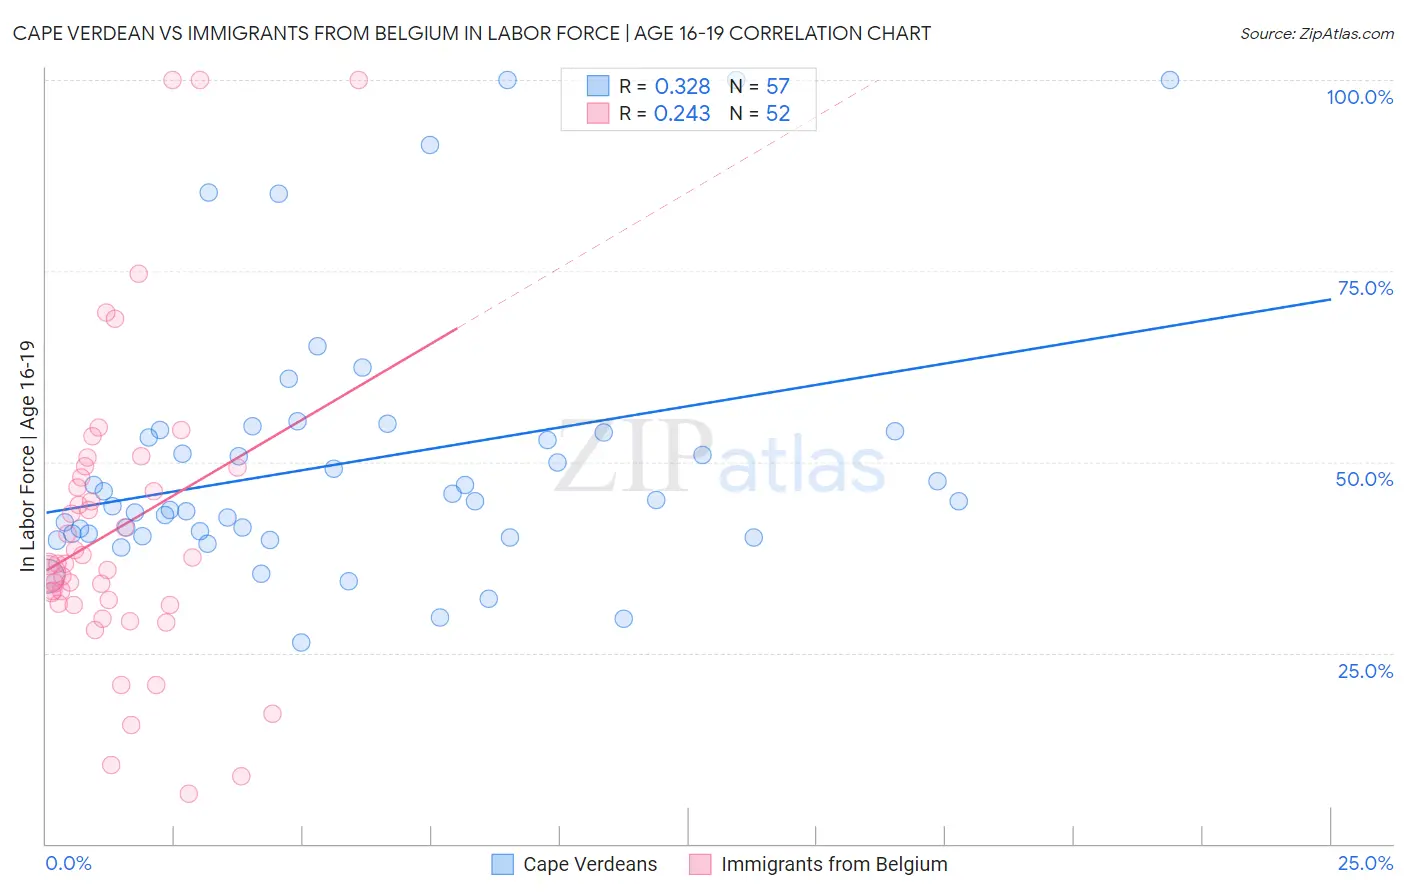
Cape Verdean vs Immigrants from Belgium In Labor Force | Age 16-19 Correlation Chart
The statistical analysis conducted on geographies consisting of 107,547,633 people shows a mild positive correlation between the proportion of Cape Verdeans and labor force participation rate among population between the ages 16 and 19 in the United States with a correlation coefficient (R) of 0.328 and weighted average of 44.5%. Similarly, the statistical analysis conducted on geographies consisting of 146,618,217 people shows a weak positive correlation between the proportion of Immigrants from Belgium and labor force participation rate among population between the ages 16 and 19 in the United States with a correlation coefficient (R) of 0.243 and weighted average of 35.3%, a difference of 26.0%.
In Labor Force | Age 16-19 Correlation Summary
| Measurement | Cape Verdean | Immigrants from Belgium |
| Minimum | 26.3% | 6.6% |
| Maximum | 100.0% | 100.0% |
| Range | 73.7% | 93.4% |
| Mean | 50.0% | 41.3% |
| Median | 44.9% | 36.7% |
| Interquartile 25% (IQ1) | 40.4% | 31.4% |
| Interquartile 75% (IQ3) | 53.9% | 48.6% |
| Interquartile Range (IQR) | 13.5% | 17.2% |
| Standard Deviation (Sample) | 17.1% | 20.2% |
| Standard Deviation (Population) | 17.0% | 20.0% |
Similar Demographics by In Labor Force | Age 16-19
Demographics Similar to Cape Verdeans by In Labor Force | Age 16-19
In terms of in labor force | age 16-19, the demographic groups most similar to Cape Verdeans are Immigrants from Cabo Verde (44.7%, a difference of 0.42%), Danish (44.7%, a difference of 0.46%), German (44.2%, a difference of 0.74%), Swedish (44.1%, a difference of 0.82%), and Finnish (43.9%, a difference of 1.3%).
| Demographics | Rating | Rank | In Labor Force | Age 16-19 |
| Norwegians | 100.0 /100 | #2 | Exceptional 46.2% |
| Immigrants | Somalia | 100.0 /100 | #3 | Exceptional 45.6% |
| Luxembourgers | 100.0 /100 | #4 | Exceptional 45.3% |
| Alaskan Athabascans | 100.0 /100 | #5 | Exceptional 45.2% |
| Somalis | 100.0 /100 | #6 | Exceptional 45.1% |
| Danes | 100.0 /100 | #7 | Exceptional 44.7% |
| Immigrants | Cabo Verde | 100.0 /100 | #8 | Exceptional 44.7% |
| Cape Verdeans | 100.0 /100 | #9 | Exceptional 44.5% |
| Germans | 100.0 /100 | #10 | Exceptional 44.2% |
| Swedes | 100.0 /100 | #11 | Exceptional 44.1% |
| Finns | 100.0 /100 | #12 | Exceptional 43.9% |
| Dutch | 100.0 /100 | #13 | Exceptional 43.8% |
| Chippewa | 100.0 /100 | #14 | Exceptional 43.8% |
| Slovenes | 100.0 /100 | #15 | Exceptional 43.7% |
| Czechs | 100.0 /100 | #16 | Exceptional 43.6% |
Demographics Similar to Immigrants from Belgium by In Labor Force | Age 16-19
In terms of in labor force | age 16-19, the demographic groups most similar to Immigrants from Belgium are Honduran (35.3%, a difference of 0.080%), Ghanaian (35.3%, a difference of 0.090%), Immigrants from Guatemala (35.3%, a difference of 0.090%), Mongolian (35.3%, a difference of 0.10%), and Immigrants from Senegal (35.3%, a difference of 0.15%).
| Demographics | Rating | Rank | In Labor Force | Age 16-19 |
| Sri Lankans | 9.8 /100 | #218 | Tragic 35.5% |
| Guatemalans | 8.6 /100 | #219 | Tragic 35.5% |
| Immigrants | Bahamas | 8.3 /100 | #220 | Tragic 35.5% |
| Turks | 7.3 /100 | #221 | Tragic 35.4% |
| Immigrants | Ghana | 7.3 /100 | #222 | Tragic 35.4% |
| Ghanaians | 6.5 /100 | #223 | Tragic 35.3% |
| Hondurans | 6.5 /100 | #224 | Tragic 35.3% |
| Immigrants | Belgium | 6.1 /100 | #225 | Tragic 35.3% |
| Immigrants | Guatemala | 5.7 /100 | #226 | Tragic 35.3% |
| Mongolians | 5.7 /100 | #227 | Tragic 35.3% |
| Immigrants | Senegal | 5.5 /100 | #228 | Tragic 35.3% |
| Immigrants | Lebanon | 5.0 /100 | #229 | Tragic 35.2% |
| Immigrants | Honduras | 4.9 /100 | #230 | Tragic 35.2% |
| Immigrants | Syria | 4.5 /100 | #231 | Tragic 35.2% |
| Immigrants | Kazakhstan | 4.5 /100 | #232 | Tragic 35.2% |