Cape Verdean vs Immigrants from Croatia In Labor Force | Age 16-19
COMPARE
Cape Verdean
Immigrants from Croatia
In Labor Force | Age 16-19
In Labor Force | Age 16-19 Comparison
Cape Verdeans
Immigrants from Croatia
44.5%
IN LABOR FORCE | AGE 16-19
100.0/ 100
METRIC RATING
9th/ 347
METRIC RANK
36.1%
IN LABOR FORCE | AGE 16-19
27.5/ 100
METRIC RATING
191st/ 347
METRIC RANK
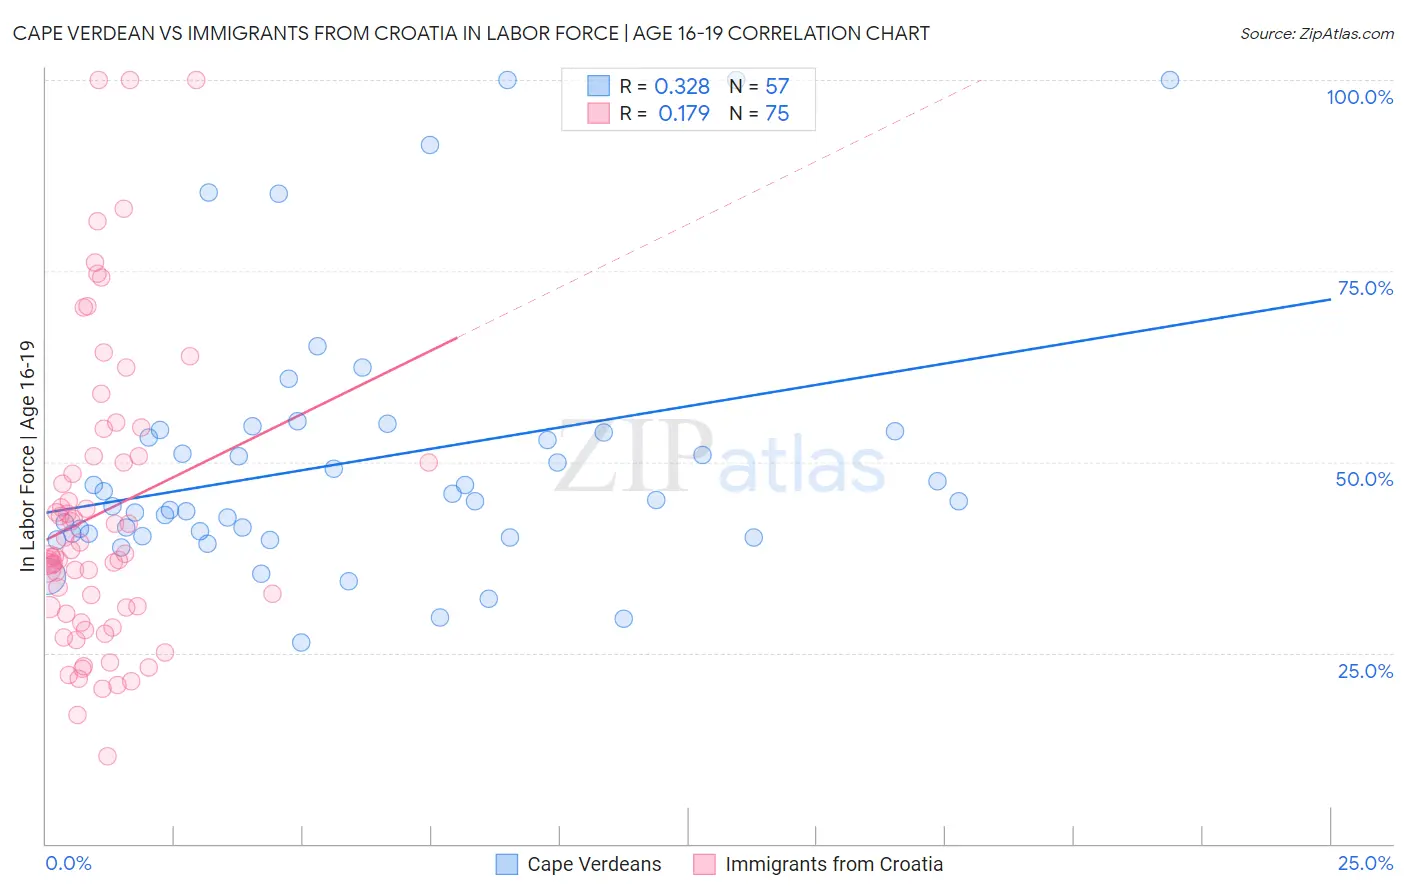
Cape Verdean vs Immigrants from Croatia In Labor Force | Age 16-19 Correlation Chart
The statistical analysis conducted on geographies consisting of 107,547,633 people shows a mild positive correlation between the proportion of Cape Verdeans and labor force participation rate among population between the ages 16 and 19 in the United States with a correlation coefficient (R) of 0.328 and weighted average of 44.5%. Similarly, the statistical analysis conducted on geographies consisting of 132,497,839 people shows a poor positive correlation between the proportion of Immigrants from Croatia and labor force participation rate among population between the ages 16 and 19 in the United States with a correlation coefficient (R) of 0.179 and weighted average of 36.1%, a difference of 23.2%.
In Labor Force | Age 16-19 Correlation Summary
| Measurement | Cape Verdean | Immigrants from Croatia |
| Minimum | 26.3% | 11.5% |
| Maximum | 100.0% | 100.0% |
| Range | 73.7% | 88.5% |
| Mean | 50.0% | 43.3% |
| Median | 44.9% | 37.8% |
| Interquartile 25% (IQ1) | 40.4% | 30.1% |
| Interquartile 75% (IQ3) | 53.9% | 50.7% |
| Interquartile Range (IQR) | 13.5% | 20.6% |
| Standard Deviation (Sample) | 17.1% | 19.6% |
| Standard Deviation (Population) | 17.0% | 19.5% |
Similar Demographics by In Labor Force | Age 16-19
Demographics Similar to Cape Verdeans by In Labor Force | Age 16-19
In terms of in labor force | age 16-19, the demographic groups most similar to Cape Verdeans are Immigrants from Cabo Verde (44.7%, a difference of 0.42%), Danish (44.7%, a difference of 0.46%), German (44.2%, a difference of 0.74%), Swedish (44.1%, a difference of 0.82%), and Finnish (43.9%, a difference of 1.3%).
| Demographics | Rating | Rank | In Labor Force | Age 16-19 |
| Norwegians | 100.0 /100 | #2 | Exceptional 46.2% |
| Immigrants | Somalia | 100.0 /100 | #3 | Exceptional 45.6% |
| Luxembourgers | 100.0 /100 | #4 | Exceptional 45.3% |
| Alaskan Athabascans | 100.0 /100 | #5 | Exceptional 45.2% |
| Somalis | 100.0 /100 | #6 | Exceptional 45.1% |
| Danes | 100.0 /100 | #7 | Exceptional 44.7% |
| Immigrants | Cabo Verde | 100.0 /100 | #8 | Exceptional 44.7% |
| Cape Verdeans | 100.0 /100 | #9 | Exceptional 44.5% |
| Germans | 100.0 /100 | #10 | Exceptional 44.2% |
| Swedes | 100.0 /100 | #11 | Exceptional 44.1% |
| Finns | 100.0 /100 | #12 | Exceptional 43.9% |
| Dutch | 100.0 /100 | #13 | Exceptional 43.8% |
| Chippewa | 100.0 /100 | #14 | Exceptional 43.8% |
| Slovenes | 100.0 /100 | #15 | Exceptional 43.7% |
| Czechs | 100.0 /100 | #16 | Exceptional 43.6% |
Demographics Similar to Immigrants from Croatia by In Labor Force | Age 16-19
In terms of in labor force | age 16-19, the demographic groups most similar to Immigrants from Croatia are Panamanian (36.1%, a difference of 0.070%), Immigrants from Hungary (36.2%, a difference of 0.080%), Afghan (36.1%, a difference of 0.12%), Immigrants from Denmark (36.1%, a difference of 0.17%), and Nigerian (36.1%, a difference of 0.19%).
| Demographics | Rating | Rank | In Labor Force | Age 16-19 |
| Costa Ricans | 36.1 /100 | #184 | Fair 36.3% |
| Bhutanese | 35.3 /100 | #185 | Fair 36.3% |
| Immigrants | Romania | 34.0 /100 | #186 | Fair 36.3% |
| Immigrants | Afghanistan | 34.0 /100 | #187 | Fair 36.3% |
| Immigrants | Europe | 31.8 /100 | #188 | Fair 36.2% |
| Immigrants | Hungary | 28.8 /100 | #189 | Fair 36.2% |
| Panamanians | 28.6 /100 | #190 | Fair 36.1% |
| Immigrants | Croatia | 27.5 /100 | #191 | Fair 36.1% |
| Afghans | 25.7 /100 | #192 | Fair 36.1% |
| Immigrants | Denmark | 25.0 /100 | #193 | Fair 36.1% |
| Nigerians | 24.6 /100 | #194 | Fair 36.1% |
| Bolivians | 23.3 /100 | #195 | Fair 36.0% |
| Mexican American Indians | 21.1 /100 | #196 | Fair 36.0% |
| Immigrants | Serbia | 21.0 /100 | #197 | Fair 36.0% |
| Immigrants | Northern Africa | 19.9 /100 | #198 | Poor 35.9% |