Cape Verdean vs Immigrants from Argentina In Labor Force | Age 16-19
COMPARE
Cape Verdean
Immigrants from Argentina
In Labor Force | Age 16-19
In Labor Force | Age 16-19 Comparison
Cape Verdeans
Immigrants from Argentina
44.5%
IN LABOR FORCE | AGE 16-19
100.0/ 100
METRIC RATING
9th/ 347
METRIC RANK
32.9%
IN LABOR FORCE | AGE 16-19
0.0/ 100
METRIC RATING
300th/ 347
METRIC RANK
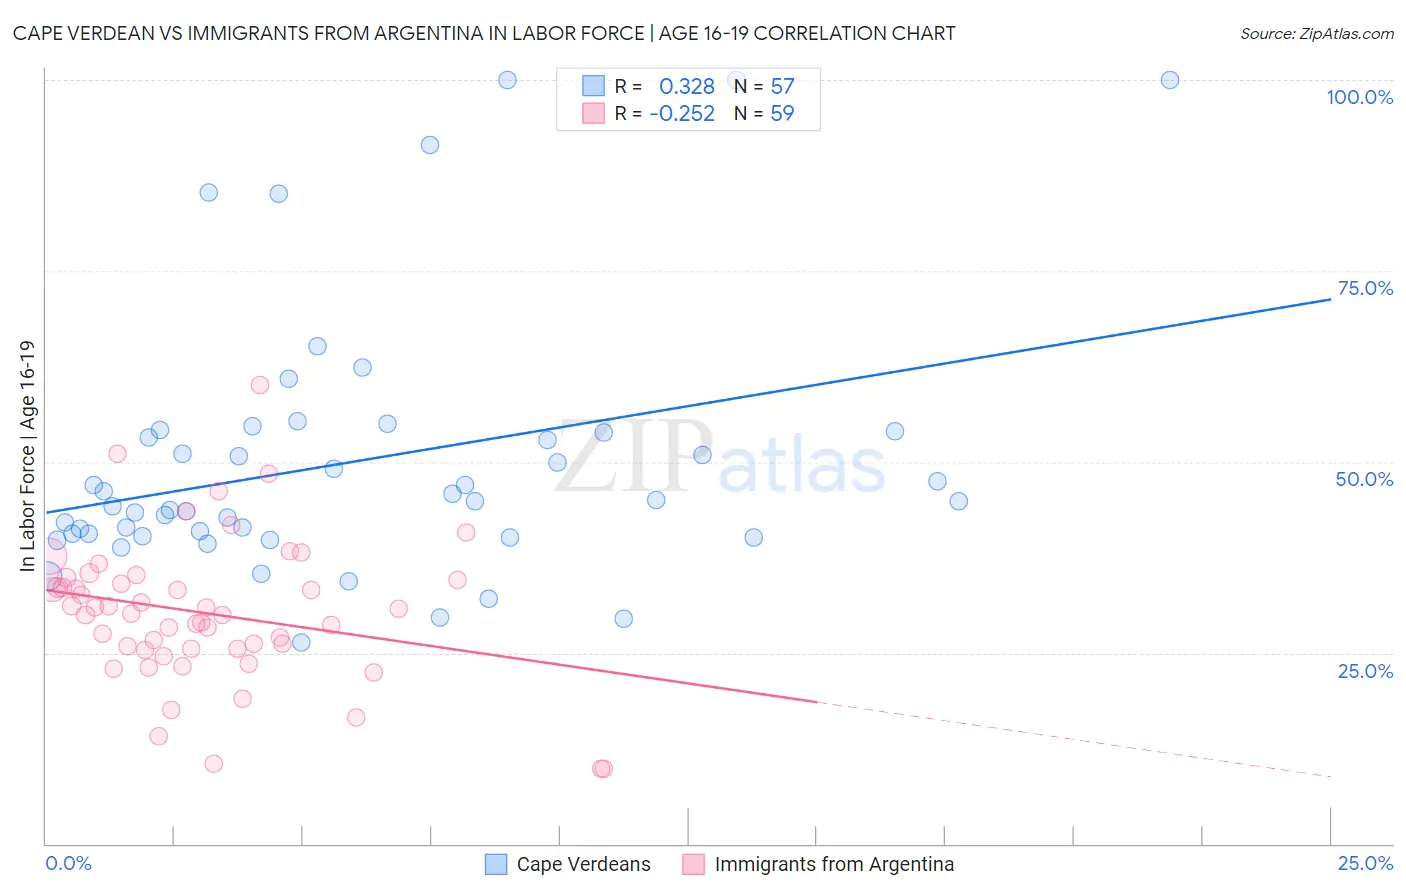
Cape Verdean vs Immigrants from Argentina In Labor Force | Age 16-19 Correlation Chart
The statistical analysis conducted on geographies consisting of 107,547,633 people shows a mild positive correlation between the proportion of Cape Verdeans and labor force participation rate among population between the ages 16 and 19 in the United States with a correlation coefficient (R) of 0.328 and weighted average of 44.5%. Similarly, the statistical analysis conducted on geographies consisting of 264,171,255 people shows a weak negative correlation between the proportion of Immigrants from Argentina and labor force participation rate among population between the ages 16 and 19 in the United States with a correlation coefficient (R) of -0.252 and weighted average of 32.9%, a difference of 35.3%.
In Labor Force | Age 16-19 Correlation Summary
| Measurement | Cape Verdean | Immigrants from Argentina |
| Minimum | 26.3% | 9.8% |
| Maximum | 100.0% | 60.0% |
| Range | 73.7% | 50.2% |
| Mean | 50.0% | 30.2% |
| Median | 44.9% | 30.2% |
| Interquartile 25% (IQ1) | 40.4% | 25.5% |
| Interquartile 75% (IQ3) | 53.9% | 34.5% |
| Interquartile Range (IQR) | 13.5% | 9.0% |
| Standard Deviation (Sample) | 17.1% | 9.4% |
| Standard Deviation (Population) | 17.0% | 9.3% |
Similar Demographics by In Labor Force | Age 16-19
Demographics Similar to Cape Verdeans by In Labor Force | Age 16-19
In terms of in labor force | age 16-19, the demographic groups most similar to Cape Verdeans are Immigrants from Cabo Verde (44.7%, a difference of 0.42%), Danish (44.7%, a difference of 0.46%), German (44.2%, a difference of 0.74%), Swedish (44.1%, a difference of 0.82%), and Finnish (43.9%, a difference of 1.3%).
| Demographics | Rating | Rank | In Labor Force | Age 16-19 |
| Norwegians | 100.0 /100 | #2 | Exceptional 46.2% |
| Immigrants | Somalia | 100.0 /100 | #3 | Exceptional 45.6% |
| Luxembourgers | 100.0 /100 | #4 | Exceptional 45.3% |
| Alaskan Athabascans | 100.0 /100 | #5 | Exceptional 45.2% |
| Somalis | 100.0 /100 | #6 | Exceptional 45.1% |
| Danes | 100.0 /100 | #7 | Exceptional 44.7% |
| Immigrants | Cabo Verde | 100.0 /100 | #8 | Exceptional 44.7% |
| Cape Verdeans | 100.0 /100 | #9 | Exceptional 44.5% |
| Germans | 100.0 /100 | #10 | Exceptional 44.2% |
| Swedes | 100.0 /100 | #11 | Exceptional 44.1% |
| Finns | 100.0 /100 | #12 | Exceptional 43.9% |
| Dutch | 100.0 /100 | #13 | Exceptional 43.8% |
| Chippewa | 100.0 /100 | #14 | Exceptional 43.8% |
| Slovenes | 100.0 /100 | #15 | Exceptional 43.7% |
| Czechs | 100.0 /100 | #16 | Exceptional 43.6% |
Demographics Similar to Immigrants from Argentina by In Labor Force | Age 16-19
In terms of in labor force | age 16-19, the demographic groups most similar to Immigrants from Argentina are Armenian (32.9%, a difference of 0.15%), Okinawan (32.8%, a difference of 0.24%), Belizean (32.8%, a difference of 0.38%), Iranian (33.0%, a difference of 0.40%), and Immigrants from Haiti (33.2%, a difference of 0.91%).
| Demographics | Rating | Rank | In Labor Force | Age 16-19 |
| Immigrants | South America | 0.1 /100 | #293 | Tragic 33.3% |
| Argentineans | 0.1 /100 | #294 | Tragic 33.3% |
| Yup'ik | 0.1 /100 | #295 | Tragic 33.3% |
| Jamaicans | 0.1 /100 | #296 | Tragic 33.2% |
| Immigrants | Haiti | 0.1 /100 | #297 | Tragic 33.2% |
| Iranians | 0.0 /100 | #298 | Tragic 33.0% |
| Armenians | 0.0 /100 | #299 | Tragic 32.9% |
| Immigrants | Argentina | 0.0 /100 | #300 | Tragic 32.9% |
| Okinawans | 0.0 /100 | #301 | Tragic 32.8% |
| Belizeans | 0.0 /100 | #302 | Tragic 32.8% |
| Immigrants | Dominica | 0.0 /100 | #303 | Tragic 32.5% |
| Israelis | 0.0 /100 | #304 | Tragic 32.4% |
| Nicaraguans | 0.0 /100 | #305 | Tragic 32.4% |
| Spanish American Indians | 0.0 /100 | #306 | Tragic 32.4% |
| Immigrants | Jamaica | 0.0 /100 | #307 | Tragic 32.2% |