Nigerian vs Pima In Labor Force | Age 25-29
COMPARE
Nigerian
Pima
In Labor Force | Age 25-29
In Labor Force | Age 25-29 Comparison
Nigerians
Pima
84.3%
IN LABOR FORCE | AGE 25-29
7.2/ 100
METRIC RATING
220th/ 347
METRIC RANK
74.3%
IN LABOR FORCE | AGE 25-29
0.0/ 100
METRIC RATING
346th/ 347
METRIC RANK
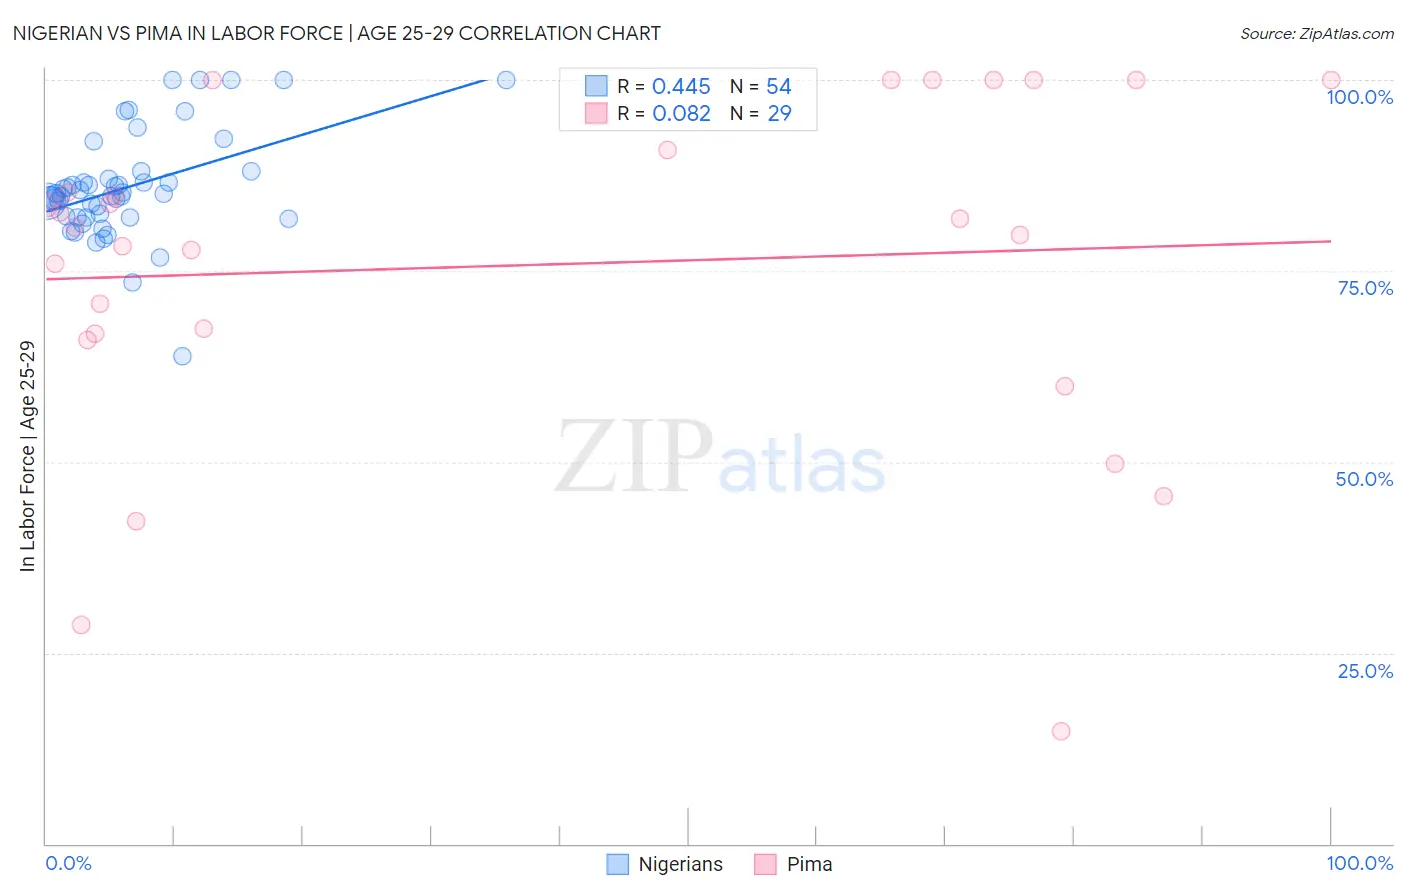
Nigerian vs Pima In Labor Force | Age 25-29 Correlation Chart
The statistical analysis conducted on geographies consisting of 332,698,985 people shows a moderate positive correlation between the proportion of Nigerians and labor force participation rate among population between the ages 25 and 29 in the United States with a correlation coefficient (R) of 0.445 and weighted average of 84.3%. Similarly, the statistical analysis conducted on geographies consisting of 61,533,053 people shows a slight positive correlation between the proportion of Pima and labor force participation rate among population between the ages 25 and 29 in the United States with a correlation coefficient (R) of 0.082 and weighted average of 74.3%, a difference of 13.4%.
In Labor Force | Age 25-29 Correlation Summary
| Measurement | Nigerian | Pima |
| Minimum | 63.9% | 14.8% |
| Maximum | 100.0% | 100.0% |
| Range | 36.1% | 85.2% |
| Mean | 85.9% | 75.8% |
| Median | 85.0% | 80.7% |
| Interquartile 25% (IQ1) | 82.0% | 66.3% |
| Interquartile 75% (IQ3) | 87.1% | 95.4% |
| Interquartile Range (IQR) | 5.1% | 29.1% |
| Standard Deviation (Sample) | 6.9% | 22.3% |
| Standard Deviation (Population) | 6.9% | 21.9% |
Similar Demographics by In Labor Force | Age 25-29
Demographics Similar to Nigerians by In Labor Force | Age 25-29
In terms of in labor force | age 25-29, the demographic groups most similar to Nigerians are Arab (84.2%, a difference of 0.010%), Jordanian (84.2%, a difference of 0.010%), Scotch-Irish (84.2%, a difference of 0.020%), Immigrants from Nigeria (84.3%, a difference of 0.040%), and Immigrants from Saudi Arabia (84.3%, a difference of 0.040%).
| Demographics | Rating | Rank | In Labor Force | Age 25-29 |
| Japanese | 11.4 /100 | #213 | Poor 84.3% |
| Lebanese | 11.1 /100 | #214 | Poor 84.3% |
| Immigrants | Syria | 10.7 /100 | #215 | Poor 84.3% |
| Israelis | 9.3 /100 | #216 | Tragic 84.3% |
| Immigrants | Ecuador | 9.3 /100 | #217 | Tragic 84.3% |
| Immigrants | Nigeria | 9.0 /100 | #218 | Tragic 84.3% |
| Immigrants | Saudi Arabia | 8.8 /100 | #219 | Tragic 84.3% |
| Nigerians | 7.2 /100 | #220 | Tragic 84.3% |
| Arabs | 6.8 /100 | #221 | Tragic 84.2% |
| Jordanians | 6.7 /100 | #222 | Tragic 84.2% |
| Scotch-Irish | 6.5 /100 | #223 | Tragic 84.2% |
| Immigrants | West Indies | 6.0 /100 | #224 | Tragic 84.2% |
| Koreans | 5.9 /100 | #225 | Tragic 84.2% |
| Immigrants | Congo | 5.8 /100 | #226 | Tragic 84.2% |
| French American Indians | 5.5 /100 | #227 | Tragic 84.2% |
Demographics Similar to Pima by In Labor Force | Age 25-29
In terms of in labor force | age 25-29, the demographic groups most similar to Pima are Navajo (74.6%, a difference of 0.48%), Yup'ik (73.1%, a difference of 1.7%), Hopi (76.5%, a difference of 3.0%), Arapaho (76.6%, a difference of 3.1%), and Pueblo (77.5%, a difference of 4.3%).
| Demographics | Rating | Rank | In Labor Force | Age 25-29 |
| Sioux | 0.0 /100 | #333 | Tragic 79.7% |
| Yuman | 0.0 /100 | #334 | Tragic 79.3% |
| Natives/Alaskans | 0.0 /100 | #335 | Tragic 79.3% |
| Apache | 0.0 /100 | #336 | Tragic 79.2% |
| Crow | 0.0 /100 | #337 | Tragic 78.6% |
| Lumbee | 0.0 /100 | #338 | Tragic 78.3% |
| Immigrants | Yemen | 0.0 /100 | #339 | Tragic 78.2% |
| Paiute | 0.0 /100 | #340 | Tragic 78.1% |
| Tohono O'odham | 0.0 /100 | #341 | Tragic 77.5% |
| Pueblo | 0.0 /100 | #342 | Tragic 77.5% |
| Arapaho | 0.0 /100 | #343 | Tragic 76.6% |
| Hopi | 0.0 /100 | #344 | Tragic 76.5% |
| Navajo | 0.0 /100 | #345 | Tragic 74.6% |
| Pima | 0.0 /100 | #346 | Tragic 74.3% |
| Yup'ik | 0.0 /100 | #347 | Tragic 73.1% |