Immigrants from Bolivia vs Immigrants from Eastern Africa In Labor Force | Age 35-44
COMPARE
Immigrants from Bolivia
Immigrants from Eastern Africa
In Labor Force | Age 35-44
In Labor Force | Age 35-44 Comparison
Immigrants from Bolivia
Immigrants from Eastern Africa
86.2%
IN LABOR FORCE | AGE 35-44
100.0/ 100
METRIC RATING
3rd/ 347
METRIC RANK
85.4%
IN LABOR FORCE | AGE 35-44
100.0/ 100
METRIC RATING
23rd/ 347
METRIC RANK
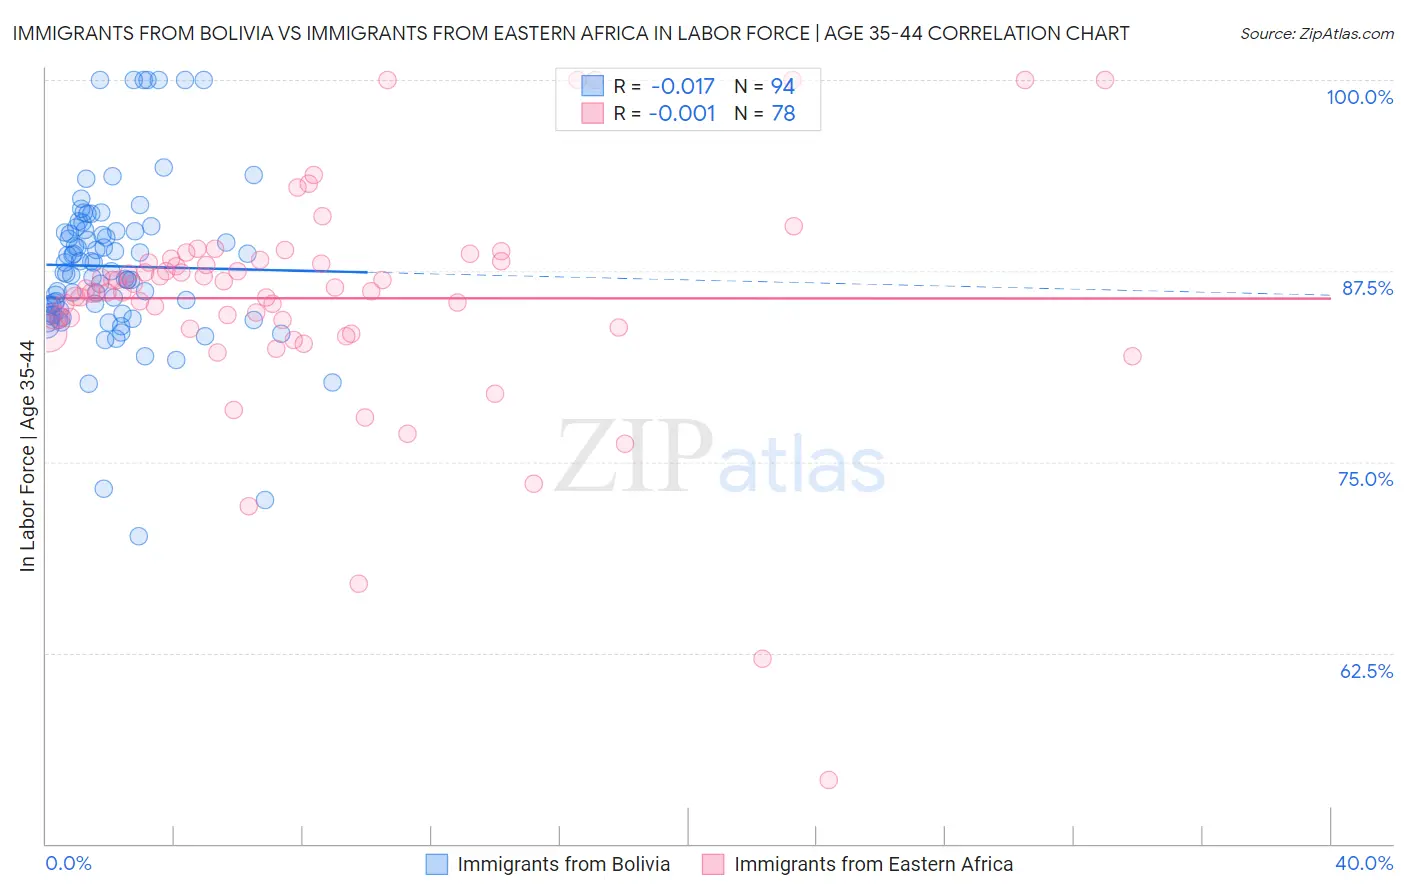
Immigrants from Bolivia vs Immigrants from Eastern Africa In Labor Force | Age 35-44 Correlation Chart
The statistical analysis conducted on geographies consisting of 158,722,541 people shows no correlation between the proportion of Immigrants from Bolivia and labor force participation rate among population between the ages 35 and 44 in the United States with a correlation coefficient (R) of -0.017 and weighted average of 86.2%. Similarly, the statistical analysis conducted on geographies consisting of 354,984,376 people shows no correlation between the proportion of Immigrants from Eastern Africa and labor force participation rate among population between the ages 35 and 44 in the United States with a correlation coefficient (R) of -0.001 and weighted average of 85.4%, a difference of 0.95%.
In Labor Force | Age 35-44 Correlation Summary
| Measurement | Immigrants from Bolivia | Immigrants from Eastern Africa |
| Minimum | 70.1% | 54.2% |
| Maximum | 100.0% | 100.0% |
| Range | 29.9% | 45.8% |
| Mean | 87.8% | 85.7% |
| Median | 87.5% | 86.2% |
| Interquartile 25% (IQ1) | 84.7% | 83.8% |
| Interquartile 75% (IQ3) | 90.1% | 88.1% |
| Interquartile Range (IQR) | 5.4% | 4.3% |
| Standard Deviation (Sample) | 5.3% | 7.4% |
| Standard Deviation (Population) | 5.3% | 7.4% |
Demographics Similar to Immigrants from Bolivia and Immigrants from Eastern Africa by In Labor Force | Age 35-44
In terms of in labor force | age 35-44, the demographic groups most similar to Immigrants from Bolivia are Immigrants from Cabo Verde (86.2%, a difference of 0.030%), Zimbabwean (86.1%, a difference of 0.16%), Bolivian (86.1%, a difference of 0.17%), Immigrants from Sierra Leone (86.1%, a difference of 0.21%), and Immigrants from Ethiopia (85.9%, a difference of 0.38%). Similarly, the demographic groups most similar to Immigrants from Eastern Africa are Immigrants from Bosnia and Herzegovina (85.4%, a difference of 0.020%), Bulgarian (85.5%, a difference of 0.060%), Immigrants from Serbia (85.5%, a difference of 0.12%), Immigrants from North Macedonia (85.6%, a difference of 0.17%), and Carpatho Rusyn (85.6%, a difference of 0.17%).
| Demographics | Rating | Rank | In Labor Force | Age 35-44 |
| Immigrants | Bolivia | 100.0 /100 | #3 | Exceptional 86.2% |
| Immigrants | Cabo Verde | 100.0 /100 | #4 | Exceptional 86.2% |
| Zimbabweans | 100.0 /100 | #5 | Exceptional 86.1% |
| Bolivians | 100.0 /100 | #6 | Exceptional 86.1% |
| Immigrants | Sierra Leone | 100.0 /100 | #7 | Exceptional 86.1% |
| Immigrants | Ethiopia | 100.0 /100 | #8 | Exceptional 85.9% |
| Ethiopians | 100.0 /100 | #9 | Exceptional 85.9% |
| Cape Verdeans | 100.0 /100 | #10 | Exceptional 85.8% |
| Immigrants | Cameroon | 100.0 /100 | #11 | Exceptional 85.8% |
| Liberians | 100.0 /100 | #12 | Exceptional 85.7% |
| Somalis | 100.0 /100 | #13 | Exceptional 85.6% |
| Immigrants | Somalia | 100.0 /100 | #14 | Exceptional 85.6% |
| Norwegians | 100.0 /100 | #15 | Exceptional 85.6% |
| Immigrants | Ireland | 100.0 /100 | #16 | Exceptional 85.6% |
| Immigrants | North Macedonia | 100.0 /100 | #17 | Exceptional 85.6% |
| Carpatho Rusyns | 100.0 /100 | #18 | Exceptional 85.6% |
| Slovenes | 100.0 /100 | #19 | Exceptional 85.6% |
| Immigrants | Serbia | 100.0 /100 | #20 | Exceptional 85.5% |
| Bulgarians | 100.0 /100 | #21 | Exceptional 85.5% |
| Immigrants | Bosnia and Herzegovina | 100.0 /100 | #22 | Exceptional 85.4% |
| Immigrants | Eastern Africa | 100.0 /100 | #23 | Exceptional 85.4% |