Bulgarian vs Cajun In Labor Force | Age 20-24
COMPARE
Bulgarian
Cajun
In Labor Force | Age 20-24
In Labor Force | Age 20-24 Comparison
Bulgarians
Cajuns
76.4%
IN LABOR FORCE | AGE 20-24
99.2/ 100
METRIC RATING
89th/ 347
METRIC RANK
75.1%
IN LABOR FORCE | AGE 20-24
51.1/ 100
METRIC RATING
171st/ 347
METRIC RANK
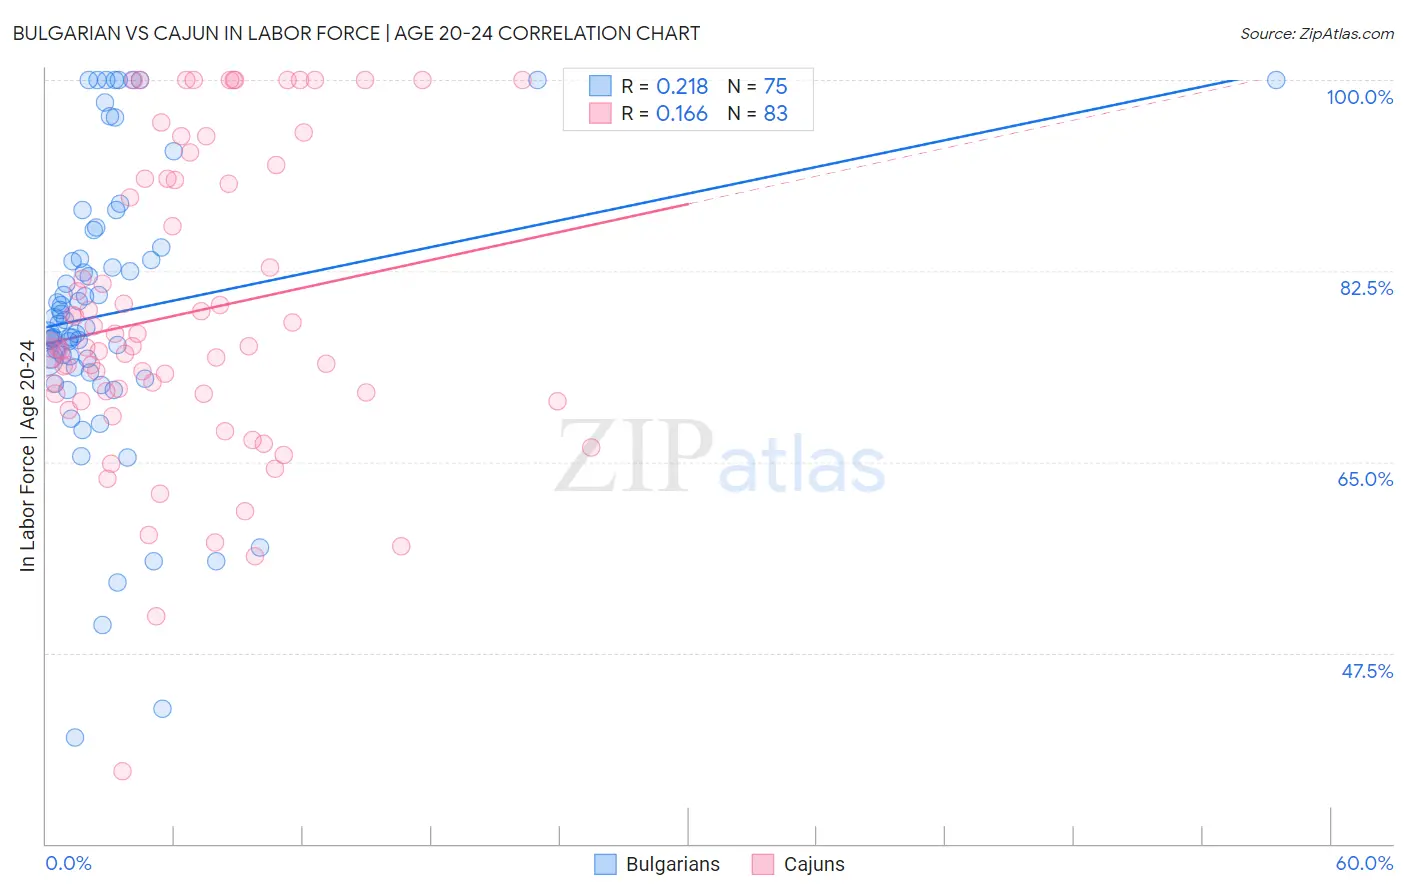
Bulgarian vs Cajun In Labor Force | Age 20-24 Correlation Chart
The statistical analysis conducted on geographies consisting of 205,574,521 people shows a weak positive correlation between the proportion of Bulgarians and labor force participation rate among population between the ages 20 and 24 in the United States with a correlation coefficient (R) of 0.218 and weighted average of 76.4%. Similarly, the statistical analysis conducted on geographies consisting of 149,676,462 people shows a poor positive correlation between the proportion of Cajuns and labor force participation rate among population between the ages 20 and 24 in the United States with a correlation coefficient (R) of 0.166 and weighted average of 75.1%, a difference of 1.7%.
In Labor Force | Age 20-24 Correlation Summary
| Measurement | Bulgarian | Cajun |
| Minimum | 39.8% | 36.6% |
| Maximum | 100.0% | 100.0% |
| Range | 60.2% | 63.4% |
| Mean | 78.7% | 78.7% |
| Median | 77.7% | 75.5% |
| Interquartile 25% (IQ1) | 73.6% | 71.2% |
| Interquartile 75% (IQ3) | 84.6% | 90.9% |
| Interquartile Range (IQR) | 11.0% | 19.7% |
| Standard Deviation (Sample) | 13.1% | 13.7% |
| Standard Deviation (Population) | 13.0% | 13.7% |
Similar Demographics by In Labor Force | Age 20-24
Demographics Similar to Bulgarians by In Labor Force | Age 20-24
In terms of in labor force | age 20-24, the demographic groups most similar to Bulgarians are Spanish (76.4%, a difference of 0.010%), Immigrants from Burma/Myanmar (76.3%, a difference of 0.050%), Immigrants from Iraq (76.4%, a difference of 0.060%), Immigrants from Thailand (76.4%, a difference of 0.060%), and Sierra Leonean (76.3%, a difference of 0.060%).
| Demographics | Rating | Rank | In Labor Force | Age 20-24 |
| Hmong | 99.5 /100 | #82 | Exceptional 76.5% |
| Carpatho Rusyns | 99.4 /100 | #83 | Exceptional 76.5% |
| Austrians | 99.4 /100 | #84 | Exceptional 76.5% |
| Portuguese | 99.3 /100 | #85 | Exceptional 76.4% |
| Immigrants | Iraq | 99.3 /100 | #86 | Exceptional 76.4% |
| Immigrants | Thailand | 99.3 /100 | #87 | Exceptional 76.4% |
| Spanish | 99.2 /100 | #88 | Exceptional 76.4% |
| Bulgarians | 99.2 /100 | #89 | Exceptional 76.4% |
| Immigrants | Burma/Myanmar | 99.1 /100 | #90 | Exceptional 76.3% |
| Sierra Leoneans | 99.0 /100 | #91 | Exceptional 76.3% |
| Maltese | 98.9 /100 | #92 | Exceptional 76.3% |
| Hungarians | 98.9 /100 | #93 | Exceptional 76.3% |
| Potawatomi | 98.5 /100 | #94 | Exceptional 76.2% |
| Immigrants | Germany | 98.5 /100 | #95 | Exceptional 76.2% |
| Immigrants | Nonimmigrants | 98.5 /100 | #96 | Exceptional 76.2% |
Demographics Similar to Cajuns by In Labor Force | Age 20-24
In terms of in labor force | age 20-24, the demographic groups most similar to Cajuns are Mexican (75.1%, a difference of 0.010%), Yakama (75.1%, a difference of 0.010%), Immigrants from Croatia (75.1%, a difference of 0.010%), South African (75.0%, a difference of 0.020%), and Syrian (75.0%, a difference of 0.020%).
| Demographics | Rating | Rank | In Labor Force | Age 20-24 |
| Bolivians | 64.0 /100 | #164 | Good 75.2% |
| Afghans | 63.5 /100 | #165 | Good 75.2% |
| Cambodians | 60.5 /100 | #166 | Good 75.2% |
| Immigrants | South Eastern Asia | 57.5 /100 | #167 | Average 75.1% |
| Immigrants | Western Africa | 56.7 /100 | #168 | Average 75.1% |
| Immigrants | Philippines | 55.8 /100 | #169 | Average 75.1% |
| Mexicans | 52.1 /100 | #170 | Average 75.1% |
| Cajuns | 51.1 /100 | #171 | Average 75.1% |
| Yakama | 50.8 /100 | #172 | Average 75.1% |
| Immigrants | Croatia | 50.2 /100 | #173 | Average 75.1% |
| South Africans | 50.0 /100 | #174 | Average 75.0% |
| Syrians | 49.5 /100 | #175 | Average 75.0% |
| Central Americans | 48.7 /100 | #176 | Average 75.0% |
| Immigrants | Mexico | 47.8 /100 | #177 | Average 75.0% |
| Immigrants | Central America | 45.0 /100 | #178 | Average 75.0% |