Bulgarian vs Yaqui In Labor Force | Age 20-24
COMPARE
Bulgarian
Yaqui
In Labor Force | Age 20-24
In Labor Force | Age 20-24 Comparison
Bulgarians
Yaqui
76.4%
IN LABOR FORCE | AGE 20-24
99.2/ 100
METRIC RATING
89th/ 347
METRIC RANK
75.5%
IN LABOR FORCE | AGE 20-24
85.5/ 100
METRIC RATING
135th/ 347
METRIC RANK
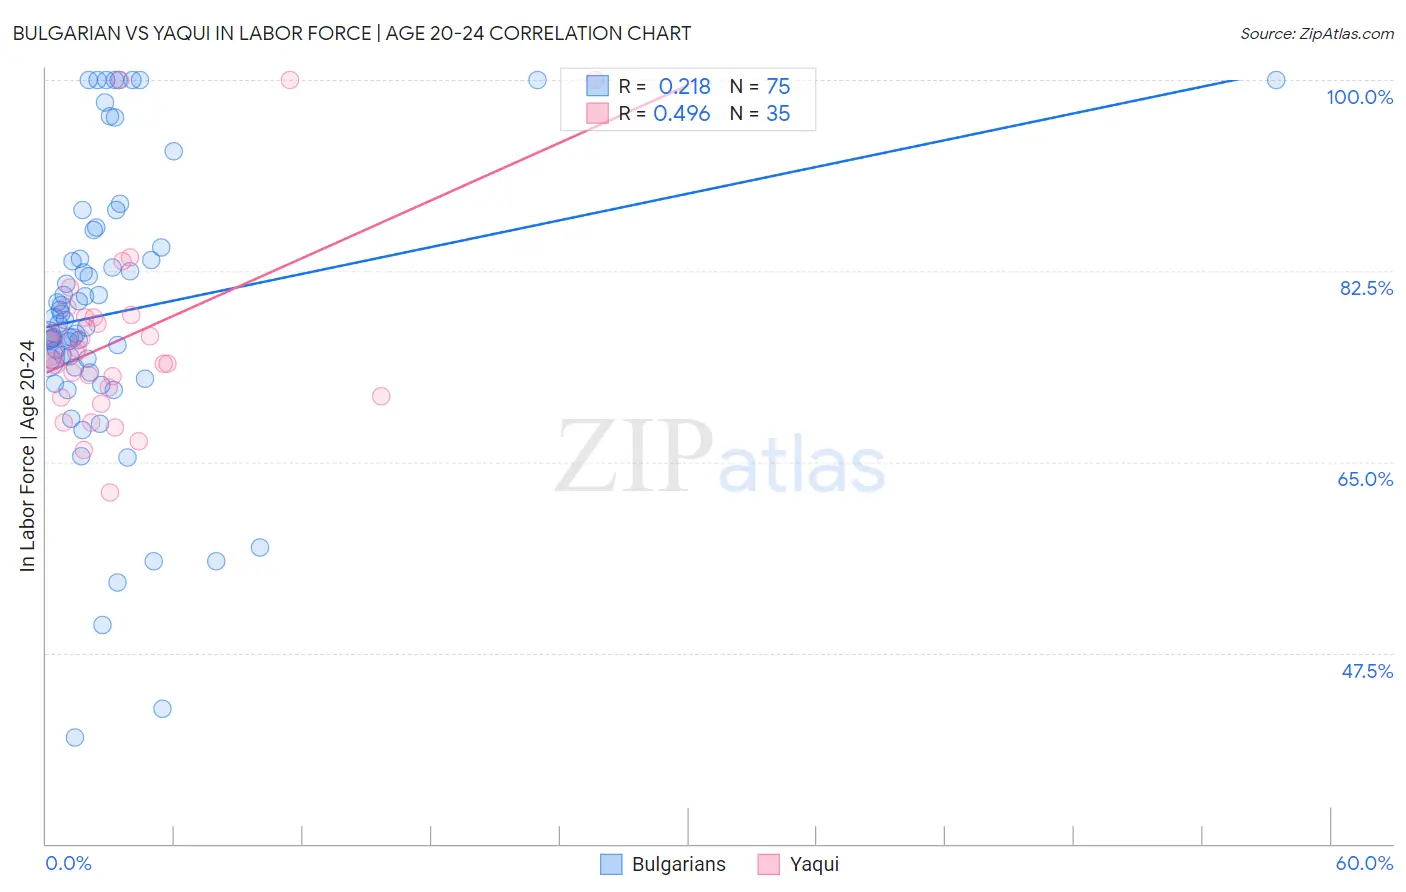
Bulgarian vs Yaqui In Labor Force | Age 20-24 Correlation Chart
The statistical analysis conducted on geographies consisting of 205,574,521 people shows a weak positive correlation between the proportion of Bulgarians and labor force participation rate among population between the ages 20 and 24 in the United States with a correlation coefficient (R) of 0.218 and weighted average of 76.4%. Similarly, the statistical analysis conducted on geographies consisting of 107,696,934 people shows a moderate positive correlation between the proportion of Yaqui and labor force participation rate among population between the ages 20 and 24 in the United States with a correlation coefficient (R) of 0.496 and weighted average of 75.5%, a difference of 1.1%.
In Labor Force | Age 20-24 Correlation Summary
| Measurement | Bulgarian | Yaqui |
| Minimum | 39.8% | 62.2% |
| Maximum | 100.0% | 100.0% |
| Range | 60.2% | 37.8% |
| Mean | 78.7% | 76.3% |
| Median | 77.7% | 75.1% |
| Interquartile 25% (IQ1) | 73.6% | 71.0% |
| Interquartile 75% (IQ3) | 84.6% | 78.3% |
| Interquartile Range (IQR) | 11.0% | 7.3% |
| Standard Deviation (Sample) | 13.1% | 8.7% |
| Standard Deviation (Population) | 13.0% | 8.6% |
Similar Demographics by In Labor Force | Age 20-24
Demographics Similar to Bulgarians by In Labor Force | Age 20-24
In terms of in labor force | age 20-24, the demographic groups most similar to Bulgarians are Spanish (76.4%, a difference of 0.010%), Immigrants from Burma/Myanmar (76.3%, a difference of 0.050%), Immigrants from Iraq (76.4%, a difference of 0.060%), Immigrants from Thailand (76.4%, a difference of 0.060%), and Sierra Leonean (76.3%, a difference of 0.060%).
| Demographics | Rating | Rank | In Labor Force | Age 20-24 |
| Hmong | 99.5 /100 | #82 | Exceptional 76.5% |
| Carpatho Rusyns | 99.4 /100 | #83 | Exceptional 76.5% |
| Austrians | 99.4 /100 | #84 | Exceptional 76.5% |
| Portuguese | 99.3 /100 | #85 | Exceptional 76.4% |
| Immigrants | Iraq | 99.3 /100 | #86 | Exceptional 76.4% |
| Immigrants | Thailand | 99.3 /100 | #87 | Exceptional 76.4% |
| Spanish | 99.2 /100 | #88 | Exceptional 76.4% |
| Bulgarians | 99.2 /100 | #89 | Exceptional 76.4% |
| Immigrants | Burma/Myanmar | 99.1 /100 | #90 | Exceptional 76.3% |
| Sierra Leoneans | 99.0 /100 | #91 | Exceptional 76.3% |
| Maltese | 98.9 /100 | #92 | Exceptional 76.3% |
| Hungarians | 98.9 /100 | #93 | Exceptional 76.3% |
| Potawatomi | 98.5 /100 | #94 | Exceptional 76.2% |
| Immigrants | Germany | 98.5 /100 | #95 | Exceptional 76.2% |
| Immigrants | Nonimmigrants | 98.5 /100 | #96 | Exceptional 76.2% |
Demographics Similar to Yaqui by In Labor Force | Age 20-24
In terms of in labor force | age 20-24, the demographic groups most similar to Yaqui are Immigrants from Brazil (75.5%, a difference of 0.020%), Jordanian (75.5%, a difference of 0.020%), Australian (75.5%, a difference of 0.020%), Immigrants from England (75.5%, a difference of 0.030%), and Delaware (75.5%, a difference of 0.030%).
| Demographics | Rating | Rank | In Labor Force | Age 20-24 |
| Immigrants | Afghanistan | 89.4 /100 | #128 | Excellent 75.6% |
| Iroquois | 89.1 /100 | #129 | Excellent 75.6% |
| Immigrants | Austria | 88.8 /100 | #130 | Excellent 75.6% |
| Immigrants | Jordan | 88.5 /100 | #131 | Excellent 75.6% |
| Palestinians | 88.4 /100 | #132 | Excellent 75.6% |
| Zimbabweans | 88.2 /100 | #133 | Excellent 75.6% |
| Estonians | 87.1 /100 | #134 | Excellent 75.6% |
| Yaqui | 85.5 /100 | #135 | Excellent 75.5% |
| Immigrants | Brazil | 84.8 /100 | #136 | Excellent 75.5% |
| Jordanians | 84.8 /100 | #137 | Excellent 75.5% |
| Australians | 84.8 /100 | #138 | Excellent 75.5% |
| Immigrants | England | 84.6 /100 | #139 | Excellent 75.5% |
| Delaware | 84.5 /100 | #140 | Excellent 75.5% |
| Romanians | 84.1 /100 | #141 | Excellent 75.5% |
| Blackfeet | 83.6 /100 | #142 | Excellent 75.5% |