Bulgarian vs Immigrants from Lebanon In Labor Force | Age 45-54
COMPARE
Bulgarian
Immigrants from Lebanon
In Labor Force | Age 45-54
In Labor Force | Age 45-54 Comparison
Bulgarians
Immigrants from Lebanon
84.2%
IN LABOR FORCE | AGE 45-54
100.0/ 100
METRIC RATING
12th/ 347
METRIC RANK
82.3%
IN LABOR FORCE | AGE 45-54
7.4/ 100
METRIC RATING
209th/ 347
METRIC RANK
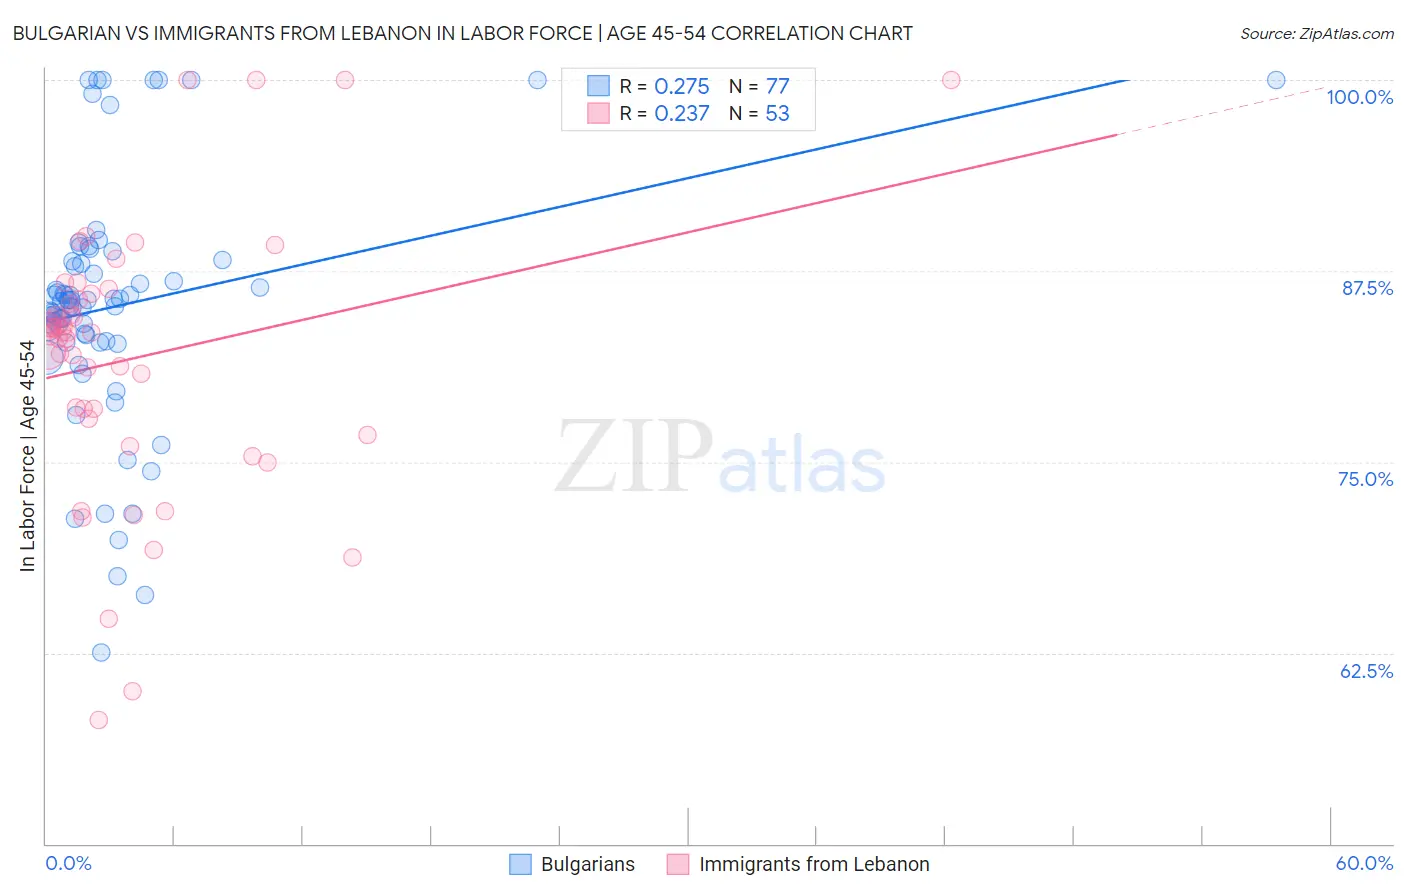
Bulgarian vs Immigrants from Lebanon In Labor Force | Age 45-54 Correlation Chart
The statistical analysis conducted on geographies consisting of 205,560,159 people shows a weak positive correlation between the proportion of Bulgarians and labor force participation rate among population between the ages 45 and 54 in the United States with a correlation coefficient (R) of 0.275 and weighted average of 84.2%. Similarly, the statistical analysis conducted on geographies consisting of 217,118,694 people shows a weak positive correlation between the proportion of Immigrants from Lebanon and labor force participation rate among population between the ages 45 and 54 in the United States with a correlation coefficient (R) of 0.237 and weighted average of 82.3%, a difference of 2.4%.
In Labor Force | Age 45-54 Correlation Summary
| Measurement | Bulgarian | Immigrants from Lebanon |
| Minimum | 62.5% | 58.1% |
| Maximum | 100.0% | 100.0% |
| Range | 37.5% | 41.9% |
| Mean | 85.2% | 81.8% |
| Median | 85.5% | 83.4% |
| Interquartile 25% (IQ1) | 82.8% | 77.3% |
| Interquartile 75% (IQ3) | 88.1% | 85.8% |
| Interquartile Range (IQR) | 5.2% | 8.5% |
| Standard Deviation (Sample) | 7.9% | 8.8% |
| Standard Deviation (Population) | 7.9% | 8.7% |
Similar Demographics by In Labor Force | Age 45-54
Demographics Similar to Bulgarians by In Labor Force | Age 45-54
In terms of in labor force | age 45-54, the demographic groups most similar to Bulgarians are Thai (84.3%, a difference of 0.11%), Chinese (84.1%, a difference of 0.11%), Cambodian (84.1%, a difference of 0.14%), Norwegian (84.4%, a difference of 0.20%), and Cypriot (84.1%, a difference of 0.20%).
| Demographics | Rating | Rank | In Labor Force | Age 45-54 |
| Ethiopians | 100.0 /100 | #5 | Exceptional 84.8% |
| Immigrants | India | 100.0 /100 | #6 | Exceptional 84.7% |
| Immigrants | Cameroon | 100.0 /100 | #7 | Exceptional 84.6% |
| Sierra Leoneans | 100.0 /100 | #8 | Exceptional 84.5% |
| Immigrants | Sierra Leone | 100.0 /100 | #9 | Exceptional 84.4% |
| Norwegians | 100.0 /100 | #10 | Exceptional 84.4% |
| Thais | 100.0 /100 | #11 | Exceptional 84.3% |
| Bulgarians | 100.0 /100 | #12 | Exceptional 84.2% |
| Chinese | 99.9 /100 | #13 | Exceptional 84.1% |
| Cambodians | 99.9 /100 | #14 | Exceptional 84.1% |
| Cypriots | 99.9 /100 | #15 | Exceptional 84.1% |
| Immigrants | Nepal | 99.9 /100 | #16 | Exceptional 84.0% |
| Zimbabweans | 99.9 /100 | #17 | Exceptional 84.0% |
| Immigrants | South Central Asia | 99.9 /100 | #18 | Exceptional 84.0% |
| Czechs | 99.8 /100 | #19 | Exceptional 83.9% |
Demographics Similar to Immigrants from Lebanon by In Labor Force | Age 45-54
In terms of in labor force | age 45-54, the demographic groups most similar to Immigrants from Lebanon are Immigrants from Bahamas (82.3%, a difference of 0.010%), Native Hawaiian (82.3%, a difference of 0.030%), Immigrants from Syria (82.3%, a difference of 0.030%), Immigrants from Cabo Verde (82.3%, a difference of 0.040%), and Ecuadorian (82.3%, a difference of 0.040%).
| Demographics | Rating | Rank | In Labor Force | Age 45-54 |
| Immigrants | Western Asia | 14.9 /100 | #202 | Poor 82.4% |
| Arabs | 11.6 /100 | #203 | Poor 82.4% |
| Immigrants | Western Europe | 10.9 /100 | #204 | Poor 82.4% |
| Senegalese | 9.5 /100 | #205 | Tragic 82.4% |
| Welsh | 9.2 /100 | #206 | Tragic 82.3% |
| Immigrants | Cabo Verde | 8.6 /100 | #207 | Tragic 82.3% |
| Native Hawaiians | 8.5 /100 | #208 | Tragic 82.3% |
| Immigrants | Lebanon | 7.4 /100 | #209 | Tragic 82.3% |
| Immigrants | Bahamas | 7.1 /100 | #210 | Tragic 82.3% |
| Immigrants | Syria | 6.6 /100 | #211 | Tragic 82.3% |
| Ecuadorians | 6.3 /100 | #212 | Tragic 82.3% |
| Immigrants | Uzbekistan | 5.8 /100 | #213 | Tragic 82.3% |
| Immigrants | Panama | 5.6 /100 | #214 | Tragic 82.2% |
| Iraqis | 5.6 /100 | #215 | Tragic 82.2% |
| Scottish | 5.3 /100 | #216 | Tragic 82.2% |