Bulgarian vs Bolivian In Labor Force | Age 45-54
COMPARE
Bulgarian
Bolivian
In Labor Force | Age 45-54
In Labor Force | Age 45-54 Comparison
Bulgarians
Bolivians
84.2%
IN LABOR FORCE | AGE 45-54
100.0/ 100
METRIC RATING
12th/ 347
METRIC RANK
84.9%
IN LABOR FORCE | AGE 45-54
100.0/ 100
METRIC RATING
3rd/ 347
METRIC RANK
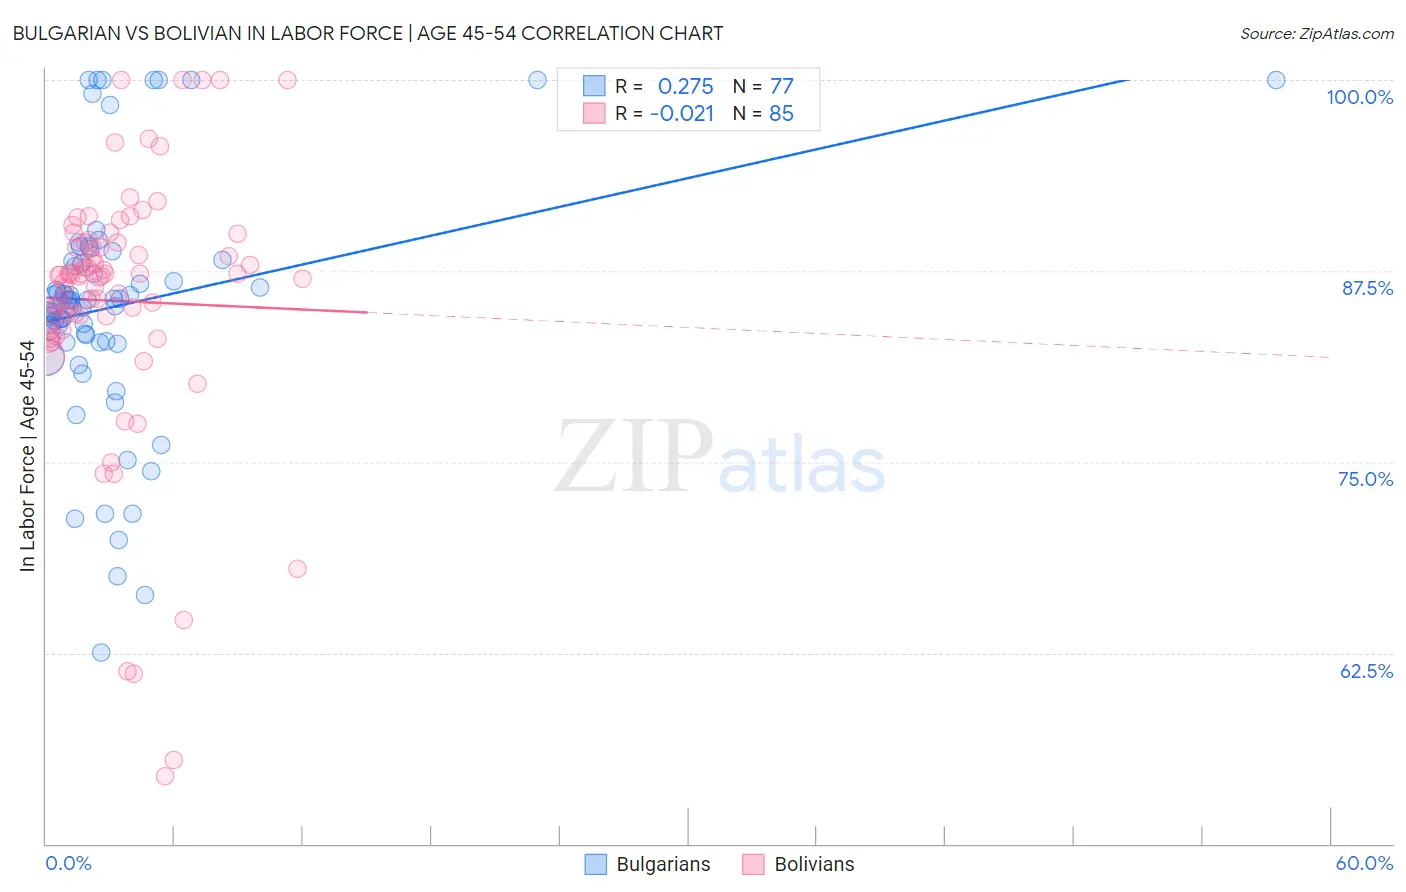
Bulgarian vs Bolivian In Labor Force | Age 45-54 Correlation Chart
The statistical analysis conducted on geographies consisting of 205,560,159 people shows a weak positive correlation between the proportion of Bulgarians and labor force participation rate among population between the ages 45 and 54 in the United States with a correlation coefficient (R) of 0.275 and weighted average of 84.2%. Similarly, the statistical analysis conducted on geographies consisting of 184,622,746 people shows no correlation between the proportion of Bolivians and labor force participation rate among population between the ages 45 and 54 in the United States with a correlation coefficient (R) of -0.021 and weighted average of 84.9%, a difference of 0.82%.
In Labor Force | Age 45-54 Correlation Summary
| Measurement | Bulgarian | Bolivian |
| Minimum | 62.5% | 54.4% |
| Maximum | 100.0% | 100.0% |
| Range | 37.5% | 45.6% |
| Mean | 85.2% | 85.5% |
| Median | 85.5% | 87.2% |
| Interquartile 25% (IQ1) | 82.8% | 84.1% |
| Interquartile 75% (IQ3) | 88.1% | 89.4% |
| Interquartile Range (IQR) | 5.2% | 5.3% |
| Standard Deviation (Sample) | 7.9% | 8.6% |
| Standard Deviation (Population) | 7.9% | 8.6% |
Demographics Similar to Bulgarians and Bolivians by In Labor Force | Age 45-54
In terms of in labor force | age 45-54, the demographic groups most similar to Bulgarians are Thai (84.3%, a difference of 0.11%), Chinese (84.1%, a difference of 0.11%), Cambodian (84.1%, a difference of 0.14%), Norwegian (84.4%, a difference of 0.20%), and Cypriot (84.1%, a difference of 0.20%). Similarly, the demographic groups most similar to Bolivians are Luxembourger (85.0%, a difference of 0.090%), Immigrants from Ethiopia (84.8%, a difference of 0.12%), Ethiopian (84.8%, a difference of 0.20%), Immigrants from India (84.7%, a difference of 0.31%), and Immigrants from Cameroon (84.6%, a difference of 0.38%).
| Demographics | Rating | Rank | In Labor Force | Age 45-54 |
| Immigrants | Bolivia | 100.0 /100 | #1 | Exceptional 85.3% |
| Luxembourgers | 100.0 /100 | #2 | Exceptional 85.0% |
| Bolivians | 100.0 /100 | #3 | Exceptional 84.9% |
| Immigrants | Ethiopia | 100.0 /100 | #4 | Exceptional 84.8% |
| Ethiopians | 100.0 /100 | #5 | Exceptional 84.8% |
| Immigrants | India | 100.0 /100 | #6 | Exceptional 84.7% |
| Immigrants | Cameroon | 100.0 /100 | #7 | Exceptional 84.6% |
| Sierra Leoneans | 100.0 /100 | #8 | Exceptional 84.5% |
| Immigrants | Sierra Leone | 100.0 /100 | #9 | Exceptional 84.4% |
| Norwegians | 100.0 /100 | #10 | Exceptional 84.4% |
| Thais | 100.0 /100 | #11 | Exceptional 84.3% |
| Bulgarians | 100.0 /100 | #12 | Exceptional 84.2% |
| Chinese | 99.9 /100 | #13 | Exceptional 84.1% |
| Cambodians | 99.9 /100 | #14 | Exceptional 84.1% |
| Cypriots | 99.9 /100 | #15 | Exceptional 84.1% |
| Immigrants | Nepal | 99.9 /100 | #16 | Exceptional 84.0% |
| Zimbabweans | 99.9 /100 | #17 | Exceptional 84.0% |
| Immigrants | South Central Asia | 99.9 /100 | #18 | Exceptional 84.0% |
| Czechs | 99.8 /100 | #19 | Exceptional 83.9% |
| Immigrants | Eastern Africa | 99.8 /100 | #20 | Exceptional 83.9% |