British West Indian vs Uruguayan In Labor Force | Age 30-34
COMPARE
British West Indian
Uruguayan
In Labor Force | Age 30-34
In Labor Force | Age 30-34 Comparison
British West Indians
Uruguayans
84.0%
IN LABOR FORCE | AGE 30-34
0.8/ 100
METRIC RATING
247th/ 347
METRIC RANK
84.9%
IN LABOR FORCE | AGE 30-34
78.5/ 100
METRIC RATING
144th/ 347
METRIC RANK
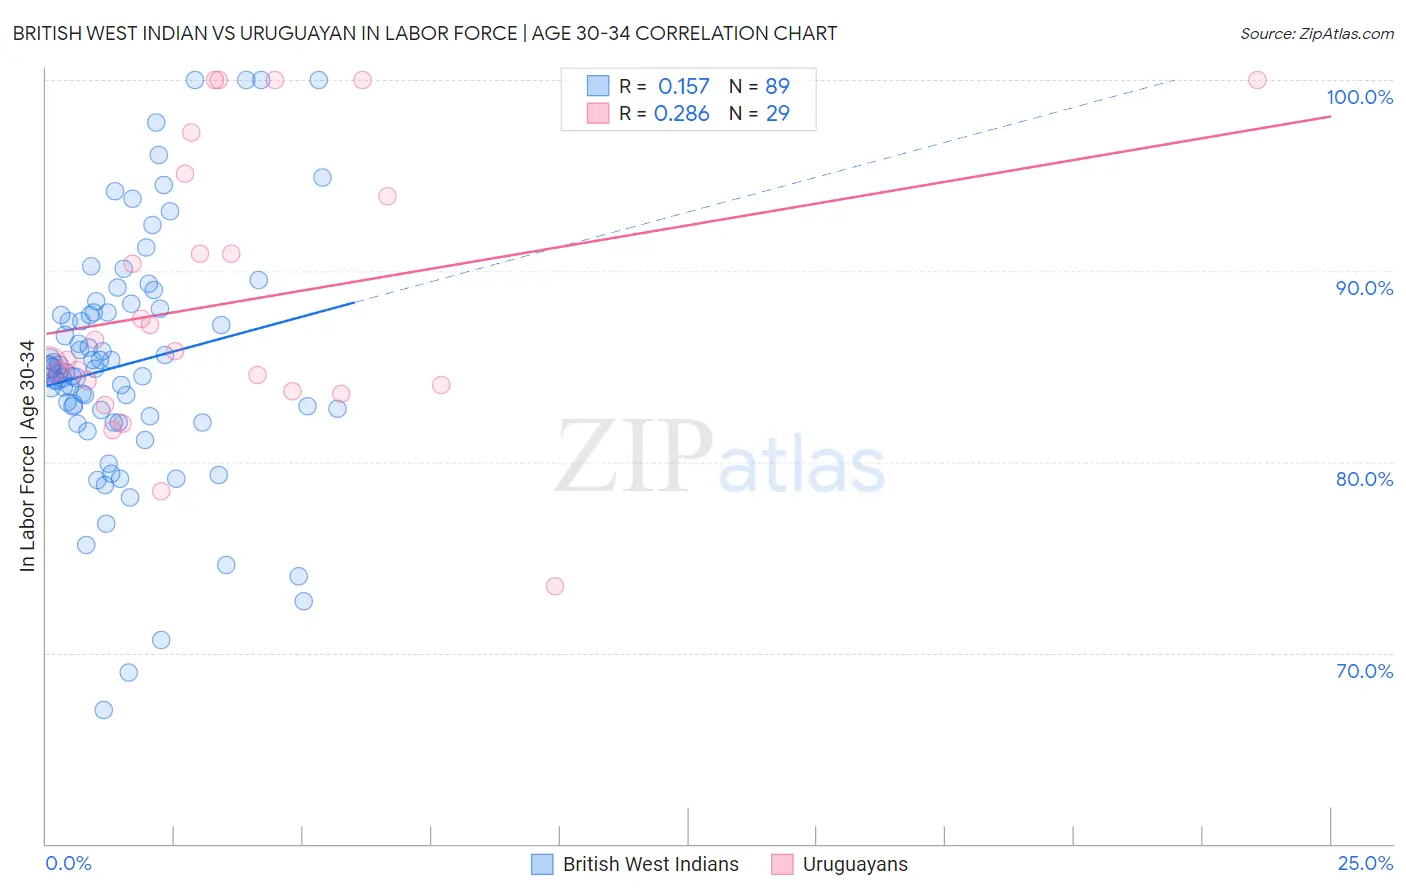
British West Indian vs Uruguayan In Labor Force | Age 30-34 Correlation Chart
The statistical analysis conducted on geographies consisting of 152,639,615 people shows a poor positive correlation between the proportion of British West Indians and labor force participation rate among population between the ages 30 and 34 in the United States with a correlation coefficient (R) of 0.157 and weighted average of 84.0%. Similarly, the statistical analysis conducted on geographies consisting of 144,764,526 people shows a weak positive correlation between the proportion of Uruguayans and labor force participation rate among population between the ages 30 and 34 in the United States with a correlation coefficient (R) of 0.286 and weighted average of 84.9%, a difference of 1.1%.
In Labor Force | Age 30-34 Correlation Summary
| Measurement | British West Indian | Uruguayan |
| Minimum | 67.0% | 73.5% |
| Maximum | 100.0% | 100.0% |
| Range | 33.0% | 26.5% |
| Mean | 85.1% | 88.4% |
| Median | 84.9% | 85.8% |
| Interquartile 25% (IQ1) | 82.2% | 83.8% |
| Interquartile 75% (IQ3) | 87.9% | 94.5% |
| Interquartile Range (IQR) | 5.7% | 10.7% |
| Standard Deviation (Sample) | 6.4% | 7.2% |
| Standard Deviation (Population) | 6.4% | 7.0% |
Similar Demographics by In Labor Force | Age 30-34
Demographics Similar to British West Indians by In Labor Force | Age 30-34
In terms of in labor force | age 30-34, the demographic groups most similar to British West Indians are Portuguese (84.0%, a difference of 0.010%), Basque (84.0%, a difference of 0.020%), Immigrants from Venezuela (84.0%, a difference of 0.020%), Central American (84.0%, a difference of 0.020%), and Immigrants from Dominica (84.0%, a difference of 0.020%).
| Demographics | Rating | Rank | In Labor Force | Age 30-34 |
| Venezuelans | 1.3 /100 | #240 | Tragic 84.0% |
| Immigrants | Portugal | 1.2 /100 | #241 | Tragic 84.0% |
| Immigrants | Oceania | 1.1 /100 | #242 | Tragic 84.0% |
| Immigrants | Caribbean | 1.1 /100 | #243 | Tragic 84.0% |
| Basques | 0.9 /100 | #244 | Tragic 84.0% |
| Immigrants | Venezuela | 0.9 /100 | #245 | Tragic 84.0% |
| Central Americans | 0.9 /100 | #246 | Tragic 84.0% |
| British West Indians | 0.8 /100 | #247 | Tragic 84.0% |
| Portuguese | 0.8 /100 | #248 | Tragic 84.0% |
| Immigrants | Dominica | 0.7 /100 | #249 | Tragic 84.0% |
| Immigrants | Iraq | 0.7 /100 | #250 | Tragic 83.9% |
| Nicaraguans | 0.6 /100 | #251 | Tragic 83.9% |
| Bahamians | 0.6 /100 | #252 | Tragic 83.9% |
| Immigrants | Nicaragua | 0.6 /100 | #253 | Tragic 83.9% |
| Immigrants | St. Vincent and the Grenadines | 0.5 /100 | #254 | Tragic 83.9% |
Demographics Similar to Uruguayans by In Labor Force | Age 30-34
In terms of in labor force | age 30-34, the demographic groups most similar to Uruguayans are Palestinian (84.9%, a difference of 0.010%), Immigrants from Saudi Arabia (84.9%, a difference of 0.020%), Immigrants from Colombia (84.9%, a difference of 0.020%), Immigrants from Pakistan (84.9%, a difference of 0.020%), and Immigrants from Ukraine (84.8%, a difference of 0.030%).
| Demographics | Rating | Rank | In Labor Force | Age 30-34 |
| South Africans | 88.0 /100 | #137 | Excellent 85.0% |
| Sri Lankans | 87.8 /100 | #138 | Excellent 85.0% |
| Bhutanese | 87.5 /100 | #139 | Excellent 85.0% |
| Immigrants | Vietnam | 86.5 /100 | #140 | Excellent 85.0% |
| Chileans | 85.3 /100 | #141 | Excellent 84.9% |
| Immigrants | Indonesia | 84.3 /100 | #142 | Excellent 84.9% |
| Colombians | 82.2 /100 | #143 | Excellent 84.9% |
| Uruguayans | 78.5 /100 | #144 | Good 84.9% |
| Palestinians | 77.7 /100 | #145 | Good 84.9% |
| Immigrants | Saudi Arabia | 76.6 /100 | #146 | Good 84.9% |
| Immigrants | Colombia | 76.3 /100 | #147 | Good 84.9% |
| Immigrants | Pakistan | 76.2 /100 | #148 | Good 84.9% |
| Immigrants | Ukraine | 75.1 /100 | #149 | Good 84.8% |
| Germans | 75.1 /100 | #150 | Good 84.8% |
| Immigrants | Senegal | 74.0 /100 | #151 | Good 84.8% |