British West Indian vs Immigrants from South Eastern Asia In Labor Force | Age 30-34
COMPARE
British West Indian
Immigrants from South Eastern Asia
In Labor Force | Age 30-34
In Labor Force | Age 30-34 Comparison
British West Indians
Immigrants from South Eastern Asia
84.0%
IN LABOR FORCE | AGE 30-34
0.8/ 100
METRIC RATING
247th/ 347
METRIC RANK
84.7%
IN LABOR FORCE | AGE 30-34
54.2/ 100
METRIC RATING
167th/ 347
METRIC RANK
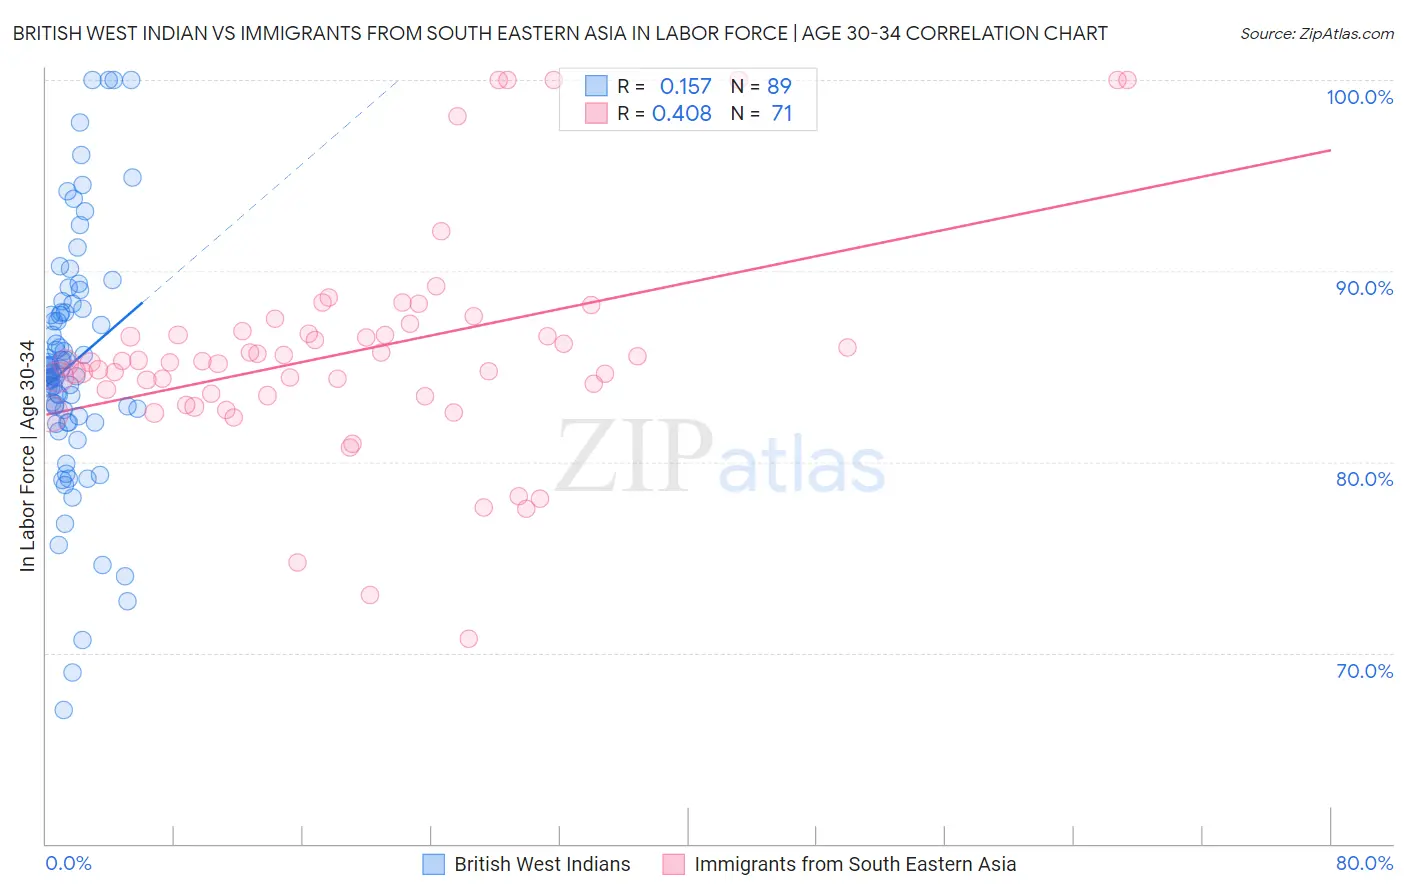
British West Indian vs Immigrants from South Eastern Asia In Labor Force | Age 30-34 Correlation Chart
The statistical analysis conducted on geographies consisting of 152,639,615 people shows a poor positive correlation between the proportion of British West Indians and labor force participation rate among population between the ages 30 and 34 in the United States with a correlation coefficient (R) of 0.157 and weighted average of 84.0%. Similarly, the statistical analysis conducted on geographies consisting of 512,225,276 people shows a moderate positive correlation between the proportion of Immigrants from South Eastern Asia and labor force participation rate among population between the ages 30 and 34 in the United States with a correlation coefficient (R) of 0.408 and weighted average of 84.7%, a difference of 0.88%.
In Labor Force | Age 30-34 Correlation Summary
| Measurement | British West Indian | Immigrants from South Eastern Asia |
| Minimum | 67.0% | 70.7% |
| Maximum | 100.0% | 100.0% |
| Range | 33.0% | 29.3% |
| Mean | 85.1% | 85.8% |
| Median | 84.9% | 85.2% |
| Interquartile 25% (IQ1) | 82.2% | 83.5% |
| Interquartile 75% (IQ3) | 87.9% | 86.9% |
| Interquartile Range (IQR) | 5.7% | 3.4% |
| Standard Deviation (Sample) | 6.4% | 5.8% |
| Standard Deviation (Population) | 6.4% | 5.8% |
Similar Demographics by In Labor Force | Age 30-34
Demographics Similar to British West Indians by In Labor Force | Age 30-34
In terms of in labor force | age 30-34, the demographic groups most similar to British West Indians are Portuguese (84.0%, a difference of 0.010%), Basque (84.0%, a difference of 0.020%), Immigrants from Venezuela (84.0%, a difference of 0.020%), Central American (84.0%, a difference of 0.020%), and Immigrants from Dominica (84.0%, a difference of 0.020%).
| Demographics | Rating | Rank | In Labor Force | Age 30-34 |
| Venezuelans | 1.3 /100 | #240 | Tragic 84.0% |
| Immigrants | Portugal | 1.2 /100 | #241 | Tragic 84.0% |
| Immigrants | Oceania | 1.1 /100 | #242 | Tragic 84.0% |
| Immigrants | Caribbean | 1.1 /100 | #243 | Tragic 84.0% |
| Basques | 0.9 /100 | #244 | Tragic 84.0% |
| Immigrants | Venezuela | 0.9 /100 | #245 | Tragic 84.0% |
| Central Americans | 0.9 /100 | #246 | Tragic 84.0% |
| British West Indians | 0.8 /100 | #247 | Tragic 84.0% |
| Portuguese | 0.8 /100 | #248 | Tragic 84.0% |
| Immigrants | Dominica | 0.7 /100 | #249 | Tragic 84.0% |
| Immigrants | Iraq | 0.7 /100 | #250 | Tragic 83.9% |
| Nicaraguans | 0.6 /100 | #251 | Tragic 83.9% |
| Bahamians | 0.6 /100 | #252 | Tragic 83.9% |
| Immigrants | Nicaragua | 0.6 /100 | #253 | Tragic 83.9% |
| Immigrants | St. Vincent and the Grenadines | 0.5 /100 | #254 | Tragic 83.9% |
Demographics Similar to Immigrants from South Eastern Asia by In Labor Force | Age 30-34
In terms of in labor force | age 30-34, the demographic groups most similar to Immigrants from South Eastern Asia are Afghan (84.7%, a difference of 0.010%), Immigrants from Peru (84.7%, a difference of 0.010%), South American Indian (84.7%, a difference of 0.010%), Immigrants from Uruguay (84.7%, a difference of 0.020%), and Icelander (84.7%, a difference of 0.020%).
| Demographics | Rating | Rank | In Labor Force | Age 30-34 |
| Pakistanis | 60.8 /100 | #160 | Good 84.7% |
| Immigrants | Cambodia | 60.7 /100 | #161 | Good 84.7% |
| South Americans | 58.7 /100 | #162 | Average 84.7% |
| Immigrants | Uruguay | 57.4 /100 | #163 | Average 84.7% |
| Icelanders | 56.8 /100 | #164 | Average 84.7% |
| Immigrants | Western Europe | 56.7 /100 | #165 | Average 84.7% |
| Afghans | 55.2 /100 | #166 | Average 84.7% |
| Immigrants | South Eastern Asia | 54.2 /100 | #167 | Average 84.7% |
| Immigrants | Peru | 52.4 /100 | #168 | Average 84.7% |
| South American Indians | 52.1 /100 | #169 | Average 84.7% |
| Immigrants | Burma/Myanmar | 52.0 /100 | #170 | Average 84.7% |
| Irish | 52.0 /100 | #171 | Average 84.7% |
| Immigrants | England | 51.7 /100 | #172 | Average 84.7% |
| Israelis | 51.1 /100 | #173 | Average 84.7% |
| Finns | 50.0 /100 | #174 | Average 84.7% |