British West Indian vs Immigrants from Cambodia In Labor Force | Age 16-19
COMPARE
British West Indian
Immigrants from Cambodia
In Labor Force | Age 16-19
In Labor Force | Age 16-19 Comparison
British West Indians
Immigrants from Cambodia
29.1%
IN LABOR FORCE | AGE 16-19
0.0/ 100
METRIC RATING
340th/ 347
METRIC RANK
36.7%
IN LABOR FORCE | AGE 16-19
58.4/ 100
METRIC RATING
171st/ 347
METRIC RANK
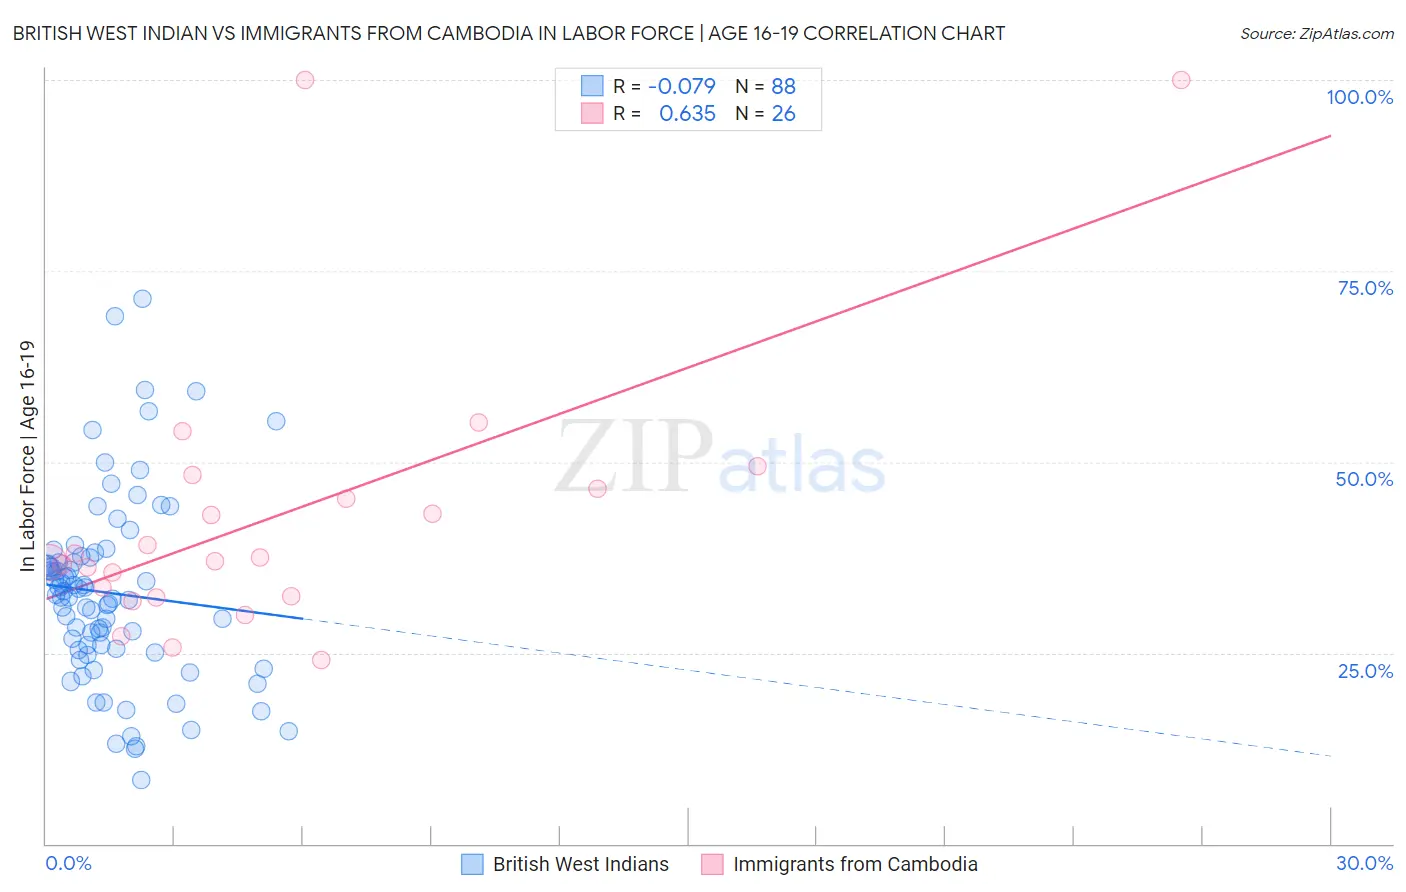
British West Indian vs Immigrants from Cambodia In Labor Force | Age 16-19 Correlation Chart
The statistical analysis conducted on geographies consisting of 152,607,678 people shows a slight negative correlation between the proportion of British West Indians and labor force participation rate among population between the ages 16 and 19 in the United States with a correlation coefficient (R) of -0.079 and weighted average of 29.1%. Similarly, the statistical analysis conducted on geographies consisting of 205,098,821 people shows a significant positive correlation between the proportion of Immigrants from Cambodia and labor force participation rate among population between the ages 16 and 19 in the United States with a correlation coefficient (R) of 0.635 and weighted average of 36.7%, a difference of 26.2%.
In Labor Force | Age 16-19 Correlation Summary
| Measurement | British West Indian | Immigrants from Cambodia |
| Minimum | 8.4% | 24.1% |
| Maximum | 71.4% | 100.0% |
| Range | 63.0% | 75.9% |
| Mean | 32.8% | 43.0% |
| Median | 32.5% | 37.2% |
| Interquartile 25% (IQ1) | 25.4% | 32.5% |
| Interquartile 75% (IQ3) | 37.2% | 46.4% |
| Interquartile Range (IQR) | 11.7% | 13.9% |
| Standard Deviation (Sample) | 12.1% | 18.6% |
| Standard Deviation (Population) | 12.0% | 18.3% |
Similar Demographics by In Labor Force | Age 16-19
Demographics Similar to British West Indians by In Labor Force | Age 16-19
In terms of in labor force | age 16-19, the demographic groups most similar to British West Indians are Immigrants from Uzbekistan (29.2%, a difference of 0.20%), Immigrants from Armenia (29.0%, a difference of 0.23%), Immigrants from Barbados (29.0%, a difference of 0.38%), Vietnamese (29.6%, a difference of 1.6%), and Immigrants from Bangladesh (30.0%, a difference of 3.3%).
| Demographics | Rating | Rank | In Labor Force | Age 16-19 |
| Immigrants | Hong Kong | 0.0 /100 | #333 | Tragic 30.5% |
| Puerto Ricans | 0.0 /100 | #334 | Tragic 30.3% |
| Immigrants | Cuba | 0.0 /100 | #335 | Tragic 30.2% |
| Immigrants | Trinidad and Tobago | 0.0 /100 | #336 | Tragic 30.2% |
| Immigrants | Bangladesh | 0.0 /100 | #337 | Tragic 30.0% |
| Vietnamese | 0.0 /100 | #338 | Tragic 29.6% |
| Immigrants | Uzbekistan | 0.0 /100 | #339 | Tragic 29.2% |
| British West Indians | 0.0 /100 | #340 | Tragic 29.1% |
| Immigrants | Armenia | 0.0 /100 | #341 | Tragic 29.0% |
| Immigrants | Barbados | 0.0 /100 | #342 | Tragic 29.0% |
| Yuman | 0.0 /100 | #343 | Tragic 27.7% |
| Guyanese | 0.0 /100 | #344 | Tragic 27.4% |
| Immigrants | Guyana | 0.0 /100 | #345 | Tragic 27.3% |
| Immigrants | St. Vincent and the Grenadines | 0.0 /100 | #346 | Tragic 26.3% |
| Immigrants | Grenada | 0.0 /100 | #347 | Tragic 25.4% |
Demographics Similar to Immigrants from Cambodia by In Labor Force | Age 16-19
In terms of in labor force | age 16-19, the demographic groups most similar to Immigrants from Cambodia are South African (36.7%, a difference of 0.010%), Russian (36.7%, a difference of 0.040%), Immigrants from South Africa (36.8%, a difference of 0.11%), Immigrants from Latvia (36.8%, a difference of 0.17%), and Palestinian (36.8%, a difference of 0.25%).
| Demographics | Rating | Rank | In Labor Force | Age 16-19 |
| Immigrants | Kuwait | 68.9 /100 | #164 | Good 36.9% |
| Yakama | 66.9 /100 | #165 | Good 36.9% |
| Immigrants | Western Africa | 66.7 /100 | #166 | Good 36.9% |
| Arabs | 63.6 /100 | #167 | Good 36.8% |
| Palestinians | 63.1 /100 | #168 | Good 36.8% |
| Immigrants | Latvia | 61.6 /100 | #169 | Good 36.8% |
| Immigrants | South Africa | 60.5 /100 | #170 | Good 36.8% |
| Immigrants | Cambodia | 58.4 /100 | #171 | Average 36.7% |
| South Africans | 58.3 /100 | #172 | Average 36.7% |
| Russians | 57.5 /100 | #173 | Average 36.7% |
| Immigrants | Czechoslovakia | 50.0 /100 | #174 | Average 36.6% |
| Natives/Alaskans | 49.0 /100 | #175 | Average 36.6% |
| Albanians | 48.8 /100 | #176 | Average 36.5% |
| Immigrants | Northern Europe | 46.6 /100 | #177 | Average 36.5% |
| Blacks/African Americans | 45.1 /100 | #178 | Average 36.5% |