British West Indian vs Immigrants from Syria In Labor Force | Age 16-19
COMPARE
British West Indian
Immigrants from Syria
In Labor Force | Age 16-19
In Labor Force | Age 16-19 Comparison
British West Indians
Immigrants from Syria
29.1%
IN LABOR FORCE | AGE 16-19
0.0/ 100
METRIC RATING
340th/ 347
METRIC RANK
35.2%
IN LABOR FORCE | AGE 16-19
4.5/ 100
METRIC RATING
231st/ 347
METRIC RANK
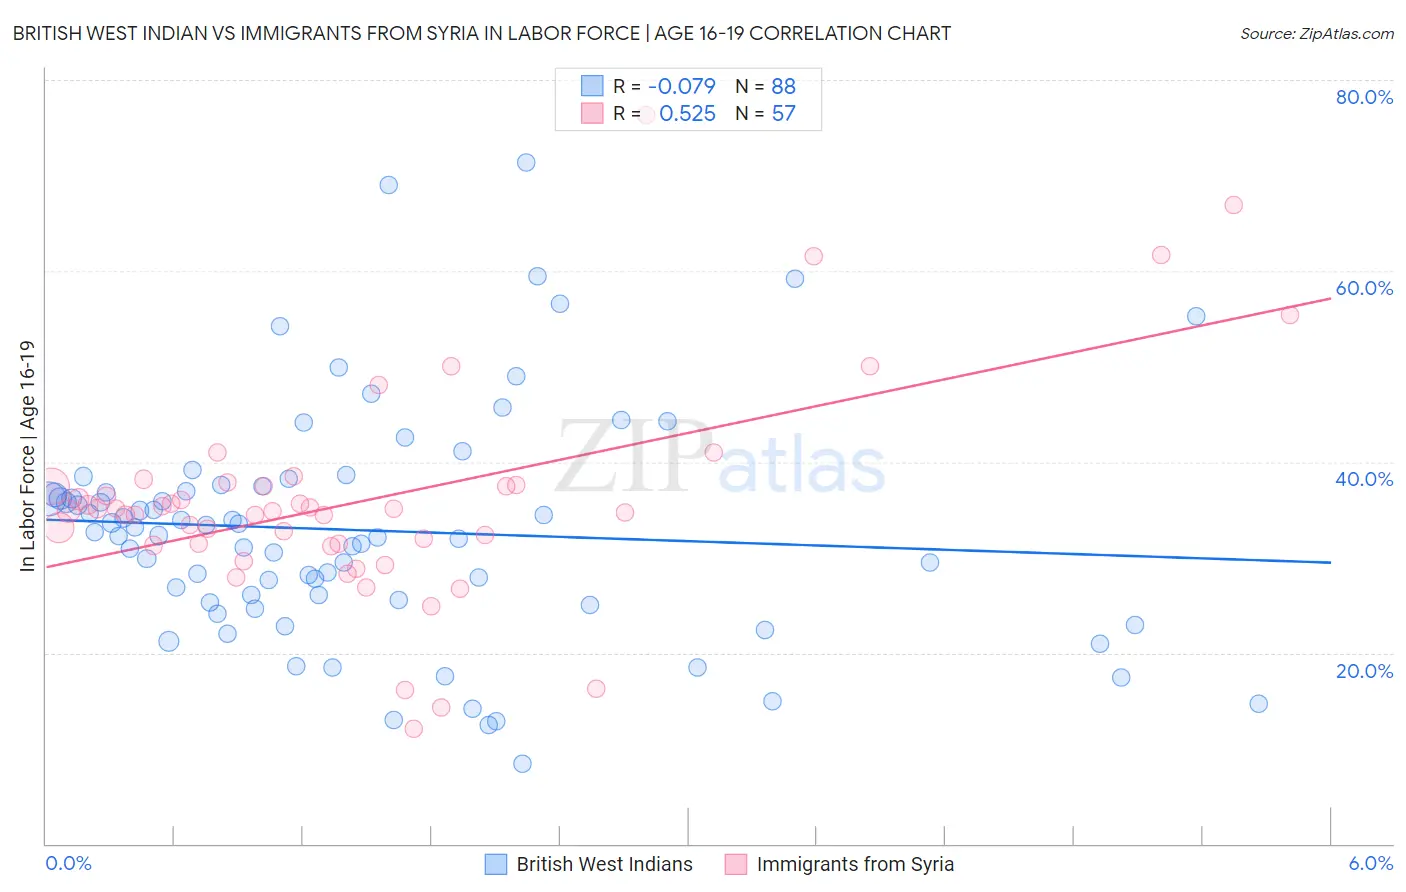
British West Indian vs Immigrants from Syria In Labor Force | Age 16-19 Correlation Chart
The statistical analysis conducted on geographies consisting of 152,607,678 people shows a slight negative correlation between the proportion of British West Indians and labor force participation rate among population between the ages 16 and 19 in the United States with a correlation coefficient (R) of -0.079 and weighted average of 29.1%. Similarly, the statistical analysis conducted on geographies consisting of 174,056,881 people shows a substantial positive correlation between the proportion of Immigrants from Syria and labor force participation rate among population between the ages 16 and 19 in the United States with a correlation coefficient (R) of 0.525 and weighted average of 35.2%, a difference of 20.8%.
In Labor Force | Age 16-19 Correlation Summary
| Measurement | British West Indian | Immigrants from Syria |
| Minimum | 8.4% | 12.0% |
| Maximum | 71.4% | 76.3% |
| Range | 63.0% | 64.3% |
| Mean | 32.8% | 36.0% |
| Median | 32.5% | 34.9% |
| Interquartile 25% (IQ1) | 25.4% | 31.3% |
| Interquartile 75% (IQ3) | 37.2% | 37.5% |
| Interquartile Range (IQR) | 11.7% | 6.2% |
| Standard Deviation (Sample) | 12.1% | 11.5% |
| Standard Deviation (Population) | 12.0% | 11.4% |
Similar Demographics by In Labor Force | Age 16-19
Demographics Similar to British West Indians by In Labor Force | Age 16-19
In terms of in labor force | age 16-19, the demographic groups most similar to British West Indians are Immigrants from Uzbekistan (29.2%, a difference of 0.20%), Immigrants from Armenia (29.0%, a difference of 0.23%), Immigrants from Barbados (29.0%, a difference of 0.38%), Vietnamese (29.6%, a difference of 1.6%), and Immigrants from Bangladesh (30.0%, a difference of 3.3%).
| Demographics | Rating | Rank | In Labor Force | Age 16-19 |
| Immigrants | Hong Kong | 0.0 /100 | #333 | Tragic 30.5% |
| Puerto Ricans | 0.0 /100 | #334 | Tragic 30.3% |
| Immigrants | Cuba | 0.0 /100 | #335 | Tragic 30.2% |
| Immigrants | Trinidad and Tobago | 0.0 /100 | #336 | Tragic 30.2% |
| Immigrants | Bangladesh | 0.0 /100 | #337 | Tragic 30.0% |
| Vietnamese | 0.0 /100 | #338 | Tragic 29.6% |
| Immigrants | Uzbekistan | 0.0 /100 | #339 | Tragic 29.2% |
| British West Indians | 0.0 /100 | #340 | Tragic 29.1% |
| Immigrants | Armenia | 0.0 /100 | #341 | Tragic 29.0% |
| Immigrants | Barbados | 0.0 /100 | #342 | Tragic 29.0% |
| Yuman | 0.0 /100 | #343 | Tragic 27.7% |
| Guyanese | 0.0 /100 | #344 | Tragic 27.4% |
| Immigrants | Guyana | 0.0 /100 | #345 | Tragic 27.3% |
| Immigrants | St. Vincent and the Grenadines | 0.0 /100 | #346 | Tragic 26.3% |
| Immigrants | Grenada | 0.0 /100 | #347 | Tragic 25.4% |
Demographics Similar to Immigrants from Syria by In Labor Force | Age 16-19
In terms of in labor force | age 16-19, the demographic groups most similar to Immigrants from Syria are Immigrants from Kazakhstan (35.2%, a difference of 0.0%), Immigrants from France (35.1%, a difference of 0.040%), Immigrants from Mexico (35.1%, a difference of 0.080%), Immigrants from Honduras (35.2%, a difference of 0.12%), and Immigrants from Lebanon (35.2%, a difference of 0.15%).
| Demographics | Rating | Rank | In Labor Force | Age 16-19 |
| Hondurans | 6.5 /100 | #224 | Tragic 35.3% |
| Immigrants | Belgium | 6.1 /100 | #225 | Tragic 35.3% |
| Immigrants | Guatemala | 5.7 /100 | #226 | Tragic 35.3% |
| Mongolians | 5.7 /100 | #227 | Tragic 35.3% |
| Immigrants | Senegal | 5.5 /100 | #228 | Tragic 35.3% |
| Immigrants | Lebanon | 5.0 /100 | #229 | Tragic 35.2% |
| Immigrants | Honduras | 4.9 /100 | #230 | Tragic 35.2% |
| Immigrants | Syria | 4.5 /100 | #231 | Tragic 35.2% |
| Immigrants | Kazakhstan | 4.5 /100 | #232 | Tragic 35.2% |
| Immigrants | France | 4.3 /100 | #233 | Tragic 35.1% |
| Immigrants | Mexico | 4.2 /100 | #234 | Tragic 35.1% |
| Immigrants | Philippines | 4.0 /100 | #235 | Tragic 35.1% |
| Immigrants | Australia | 3.6 /100 | #236 | Tragic 35.1% |
| Immigrants | India | 3.5 /100 | #237 | Tragic 35.0% |
| Immigrants | Vietnam | 3.4 /100 | #238 | Tragic 35.0% |