British West Indian vs Immigrants from Haiti In Labor Force | Age 35-44
COMPARE
British West Indian
Immigrants from Haiti
In Labor Force | Age 35-44
In Labor Force | Age 35-44 Comparison
British West Indians
Immigrants from Haiti
84.0%
IN LABOR FORCE | AGE 35-44
5.3/ 100
METRIC RATING
227th/ 347
METRIC RANK
85.0%
IN LABOR FORCE | AGE 35-44
99.1/ 100
METRIC RATING
66th/ 347
METRIC RANK
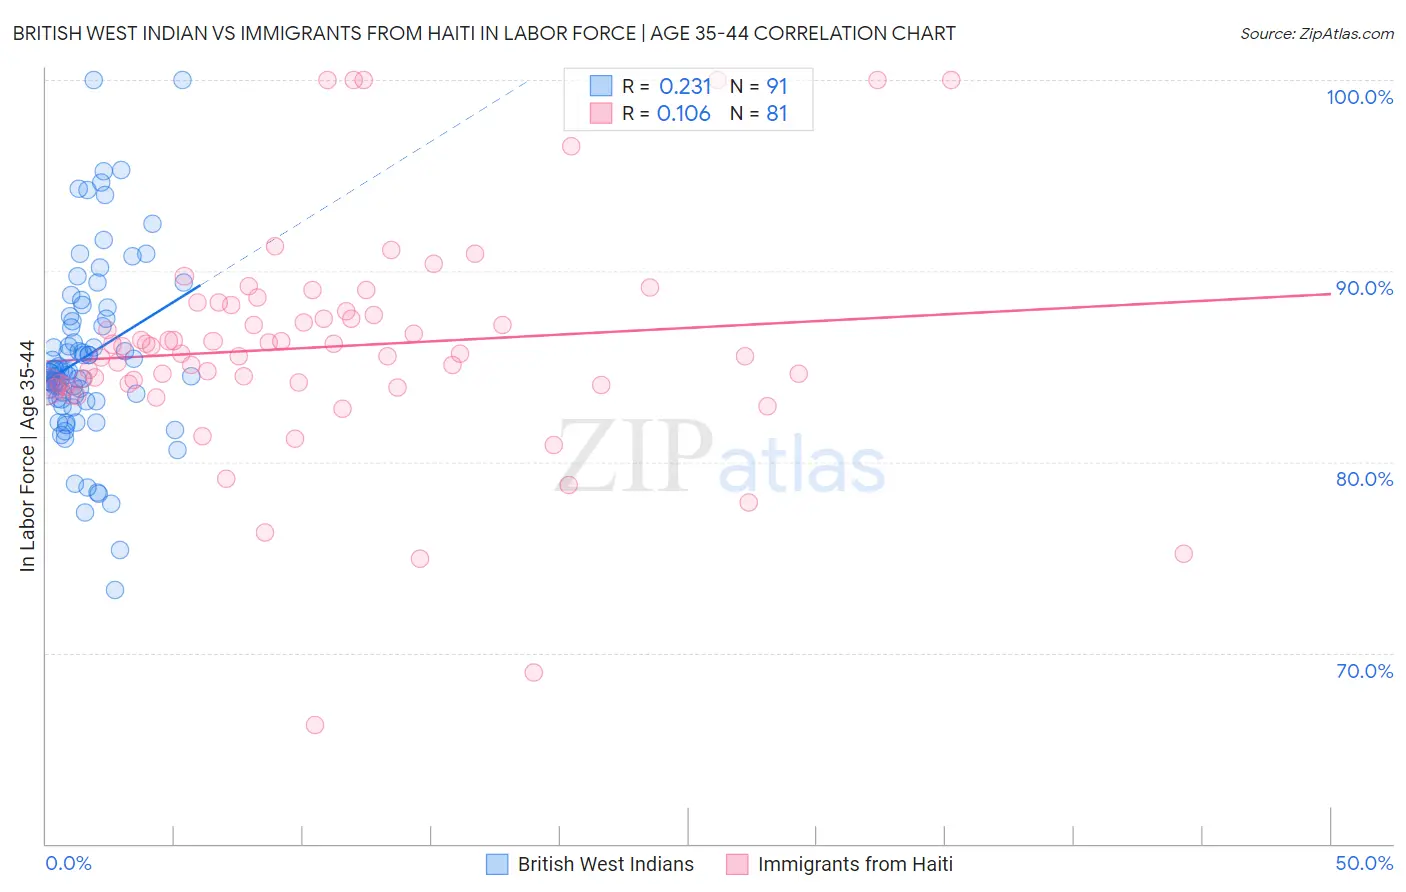
British West Indian vs Immigrants from Haiti In Labor Force | Age 35-44 Correlation Chart
The statistical analysis conducted on geographies consisting of 152,566,094 people shows a weak positive correlation between the proportion of British West Indians and labor force participation rate among population between the ages 35 and 44 in the United States with a correlation coefficient (R) of 0.231 and weighted average of 84.0%. Similarly, the statistical analysis conducted on geographies consisting of 225,199,199 people shows a poor positive correlation between the proportion of Immigrants from Haiti and labor force participation rate among population between the ages 35 and 44 in the United States with a correlation coefficient (R) of 0.106 and weighted average of 85.0%, a difference of 1.2%.
In Labor Force | Age 35-44 Correlation Summary
| Measurement | British West Indian | Immigrants from Haiti |
| Minimum | 73.3% | 66.2% |
| Maximum | 100.0% | 100.0% |
| Range | 26.7% | 33.8% |
| Mean | 85.5% | 86.0% |
| Median | 84.7% | 85.7% |
| Interquartile 25% (IQ1) | 83.3% | 84.0% |
| Interquartile 75% (IQ3) | 87.5% | 88.1% |
| Interquartile Range (IQR) | 4.2% | 4.1% |
| Standard Deviation (Sample) | 4.7% | 5.9% |
| Standard Deviation (Population) | 4.7% | 5.9% |
Similar Demographics by In Labor Force | Age 35-44
Demographics Similar to British West Indians by In Labor Force | Age 35-44
In terms of in labor force | age 35-44, the demographic groups most similar to British West Indians are Panamanian (84.0%, a difference of 0.0%), Welsh (84.0%, a difference of 0.0%), U.S. Virgin Islander (84.0%, a difference of 0.020%), Immigrants from Burma/Myanmar (84.0%, a difference of 0.020%), and Immigrants from Thailand (84.0%, a difference of 0.020%).
| Demographics | Rating | Rank | In Labor Force | Age 35-44 |
| French | 7.5 /100 | #220 | Tragic 84.0% |
| Icelanders | 6.7 /100 | #221 | Tragic 84.0% |
| Assyrians/Chaldeans/Syriacs | 6.6 /100 | #222 | Tragic 84.0% |
| Immigrants | Panama | 6.4 /100 | #223 | Tragic 84.0% |
| U.S. Virgin Islanders | 6.1 /100 | #224 | Tragic 84.0% |
| Immigrants | Burma/Myanmar | 6.1 /100 | #225 | Tragic 84.0% |
| Panamanians | 5.4 /100 | #226 | Tragic 84.0% |
| British West Indians | 5.3 /100 | #227 | Tragic 84.0% |
| Welsh | 5.3 /100 | #228 | Tragic 84.0% |
| Immigrants | Thailand | 4.7 /100 | #229 | Tragic 84.0% |
| Immigrants | Iraq | 3.7 /100 | #230 | Tragic 83.9% |
| Scottish | 3.2 /100 | #231 | Tragic 83.9% |
| Native Hawaiians | 3.0 /100 | #232 | Tragic 83.9% |
| Immigrants | Germany | 2.8 /100 | #233 | Tragic 83.9% |
| Immigrants | Oceania | 2.6 /100 | #234 | Tragic 83.9% |
Demographics Similar to Immigrants from Haiti by In Labor Force | Age 35-44
In terms of in labor force | age 35-44, the demographic groups most similar to Immigrants from Haiti are Immigrants from Brazil (85.0%, a difference of 0.0%), Immigrants from Italy (85.0%, a difference of 0.010%), Italian (85.0%, a difference of 0.010%), Swedish (85.0%, a difference of 0.020%), and Sudanese (85.0%, a difference of 0.020%).
| Demographics | Rating | Rank | In Labor Force | Age 35-44 |
| Serbians | 99.4 /100 | #59 | Exceptional 85.1% |
| Albanians | 99.4 /100 | #60 | Exceptional 85.1% |
| Immigrants | Latvia | 99.3 /100 | #61 | Exceptional 85.0% |
| Immigrants | Moldova | 99.3 /100 | #62 | Exceptional 85.0% |
| Immigrants | Uganda | 99.3 /100 | #63 | Exceptional 85.0% |
| Swedes | 99.2 /100 | #64 | Exceptional 85.0% |
| Immigrants | Brazil | 99.2 /100 | #65 | Exceptional 85.0% |
| Immigrants | Haiti | 99.1 /100 | #66 | Exceptional 85.0% |
| Immigrants | Italy | 99.1 /100 | #67 | Exceptional 85.0% |
| Italians | 99.1 /100 | #68 | Exceptional 85.0% |
| Sudanese | 99.0 /100 | #69 | Exceptional 85.0% |
| Brazilians | 99.0 /100 | #70 | Exceptional 85.0% |
| Russians | 99.0 /100 | #71 | Exceptional 85.0% |
| Immigrants | Singapore | 98.9 /100 | #72 | Exceptional 85.0% |
| Immigrants | Sri Lanka | 98.9 /100 | #73 | Exceptional 85.0% |