Brazilian vs Ute In Labor Force | Age 20-64
COMPARE
Brazilian
Ute
In Labor Force | Age 20-64
In Labor Force | Age 20-64 Comparison
Brazilians
Ute
80.5%
IN LABOR FORCE | AGE 20-64
99.8/ 100
METRIC RATING
39th/ 347
METRIC RANK
73.7%
IN LABOR FORCE | AGE 20-64
0.0/ 100
METRIC RATING
335th/ 347
METRIC RANK
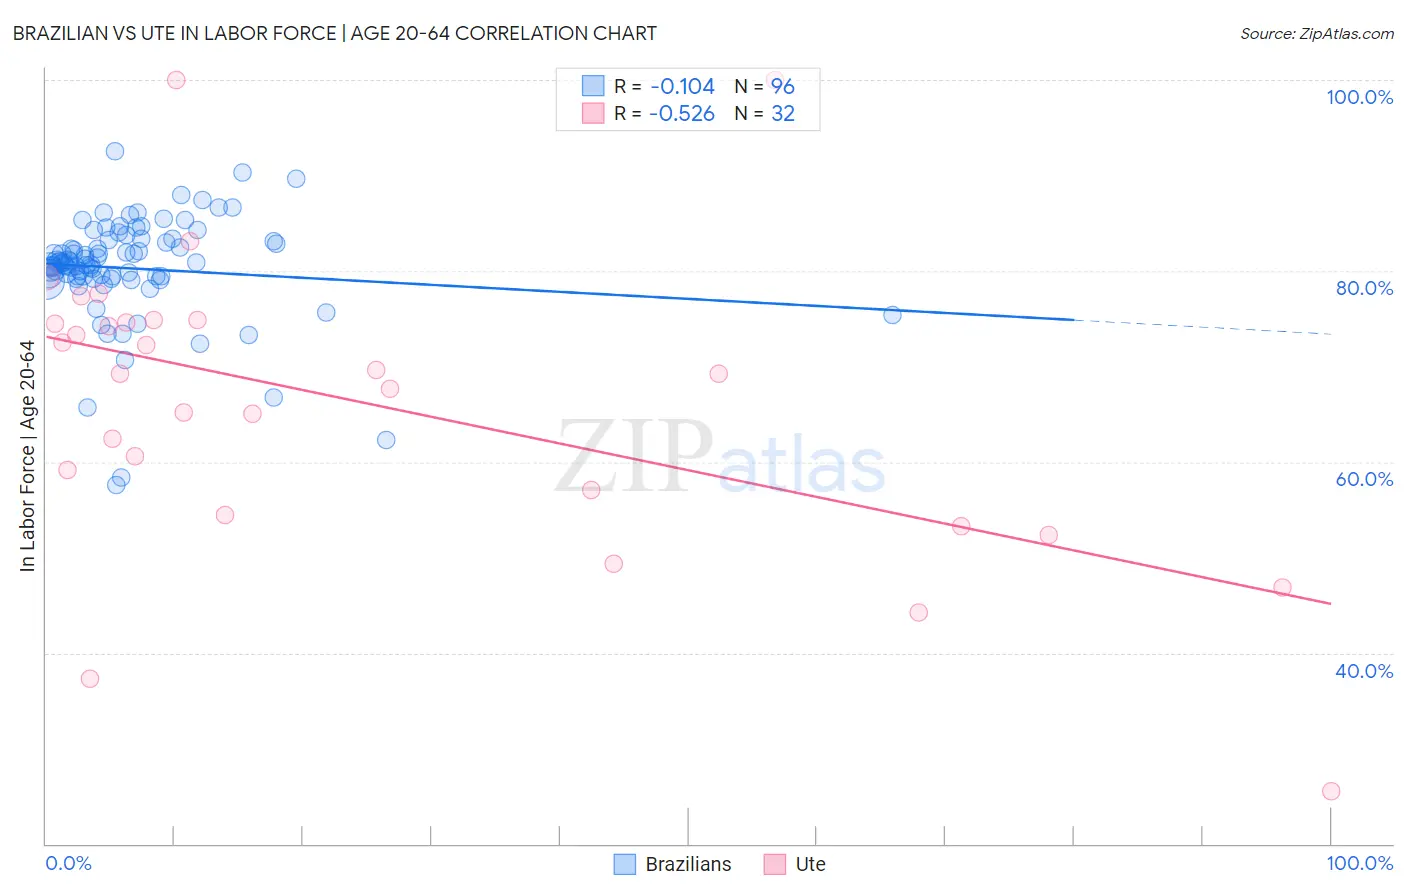
Brazilian vs Ute In Labor Force | Age 20-64 Correlation Chart
The statistical analysis conducted on geographies consisting of 323,965,381 people shows a poor negative correlation between the proportion of Brazilians and labor force participation rate among population between the ages 20 and 64 in the United States with a correlation coefficient (R) of -0.104 and weighted average of 80.5%. Similarly, the statistical analysis conducted on geographies consisting of 55,668,599 people shows a substantial negative correlation between the proportion of Ute and labor force participation rate among population between the ages 20 and 64 in the United States with a correlation coefficient (R) of -0.526 and weighted average of 73.7%, a difference of 9.3%.
In Labor Force | Age 20-64 Correlation Summary
| Measurement | Brazilian | Ute |
| Minimum | 57.6% | 25.5% |
| Maximum | 92.6% | 100.0% |
| Range | 35.0% | 74.5% |
| Mean | 80.3% | 66.1% |
| Median | 80.8% | 69.2% |
| Interquartile 25% (IQ1) | 79.3% | 55.7% |
| Interquartile 75% (IQ3) | 83.2% | 74.7% |
| Interquartile Range (IQR) | 3.8% | 19.0% |
| Standard Deviation (Sample) | 5.7% | 15.9% |
| Standard Deviation (Population) | 5.7% | 15.6% |
Similar Demographics by In Labor Force | Age 20-64
Demographics Similar to Brazilians by In Labor Force | Age 20-64
In terms of in labor force | age 20-64, the demographic groups most similar to Brazilians are Immigrants from Zimbabwe (80.5%, a difference of 0.0%), Ugandan (80.6%, a difference of 0.010%), Immigrants from Liberia (80.5%, a difference of 0.020%), Paraguayan (80.6%, a difference of 0.030%), and Immigrants from Moldova (80.6%, a difference of 0.030%).
| Demographics | Rating | Rank | In Labor Force | Age 20-64 |
| Immigrants | Ireland | 99.9 /100 | #32 | Exceptional 80.7% |
| Chinese | 99.9 /100 | #33 | Exceptional 80.7% |
| Immigrants | Brazil | 99.9 /100 | #34 | Exceptional 80.7% |
| Immigrants | Poland | 99.9 /100 | #35 | Exceptional 80.6% |
| Paraguayans | 99.8 /100 | #36 | Exceptional 80.6% |
| Immigrants | Moldova | 99.8 /100 | #37 | Exceptional 80.6% |
| Ugandans | 99.8 /100 | #38 | Exceptional 80.6% |
| Brazilians | 99.8 /100 | #39 | Exceptional 80.5% |
| Immigrants | Zimbabwe | 99.8 /100 | #40 | Exceptional 80.5% |
| Immigrants | Liberia | 99.8 /100 | #41 | Exceptional 80.5% |
| Latvians | 99.8 /100 | #42 | Exceptional 80.5% |
| Czechs | 99.7 /100 | #43 | Exceptional 80.5% |
| Immigrants | Middle Africa | 99.7 /100 | #44 | Exceptional 80.5% |
| Slovenes | 99.7 /100 | #45 | Exceptional 80.5% |
| Immigrants | Pakistan | 99.6 /100 | #46 | Exceptional 80.5% |
Demographics Similar to Ute by In Labor Force | Age 20-64
In terms of in labor force | age 20-64, the demographic groups most similar to Ute are Apache (73.7%, a difference of 0.020%), Native/Alaskan (73.9%, a difference of 0.32%), Crow (73.3%, a difference of 0.51%), Yup'ik (73.2%, a difference of 0.63%), and Puerto Rican (73.1%, a difference of 0.83%).
| Demographics | Rating | Rank | In Labor Force | Age 20-64 |
| Kiowa | 0.0 /100 | #328 | Tragic 75.0% |
| Cheyenne | 0.0 /100 | #329 | Tragic 74.8% |
| Colville | 0.0 /100 | #330 | Tragic 74.8% |
| Paiute | 0.0 /100 | #331 | Tragic 74.7% |
| Arapaho | 0.0 /100 | #332 | Tragic 74.4% |
| Natives/Alaskans | 0.0 /100 | #333 | Tragic 73.9% |
| Apache | 0.0 /100 | #334 | Tragic 73.7% |
| Ute | 0.0 /100 | #335 | Tragic 73.7% |
| Crow | 0.0 /100 | #336 | Tragic 73.3% |
| Yup'ik | 0.0 /100 | #337 | Tragic 73.2% |
| Puerto Ricans | 0.0 /100 | #338 | Tragic 73.1% |
| Houma | 0.0 /100 | #339 | Tragic 72.7% |
| Pueblo | 0.0 /100 | #340 | Tragic 72.6% |
| Immigrants | Yemen | 0.0 /100 | #341 | Tragic 72.3% |
| Yuman | 0.0 /100 | #342 | Tragic 71.7% |