Immigrants from Dominican Republic vs Ute In Labor Force | Age 20-64
COMPARE
Immigrants from Dominican Republic
Ute
In Labor Force | Age 20-64
In Labor Force | Age 20-64 Comparison
Immigrants from Dominican Republic
Ute
77.7%
IN LABOR FORCE | AGE 20-64
0.0/ 100
METRIC RATING
296th/ 347
METRIC RANK
73.7%
IN LABOR FORCE | AGE 20-64
0.0/ 100
METRIC RATING
335th/ 347
METRIC RANK
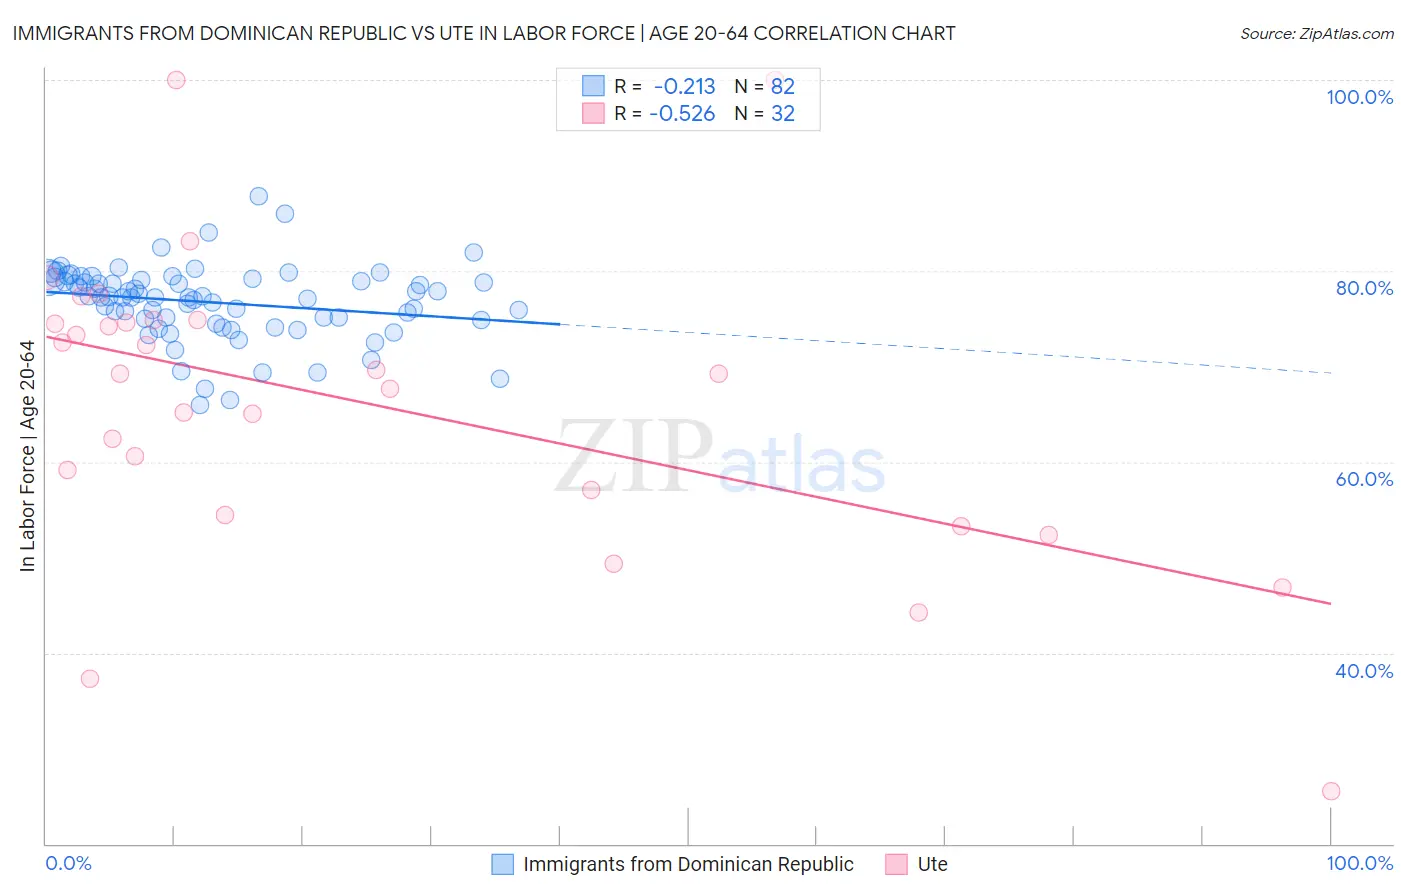
Immigrants from Dominican Republic vs Ute In Labor Force | Age 20-64 Correlation Chart
The statistical analysis conducted on geographies consisting of 275,134,528 people shows a weak negative correlation between the proportion of Immigrants from Dominican Republic and labor force participation rate among population between the ages 20 and 64 in the United States with a correlation coefficient (R) of -0.213 and weighted average of 77.7%. Similarly, the statistical analysis conducted on geographies consisting of 55,668,599 people shows a substantial negative correlation between the proportion of Ute and labor force participation rate among population between the ages 20 and 64 in the United States with a correlation coefficient (R) of -0.526 and weighted average of 73.7%, a difference of 5.4%.
In Labor Force | Age 20-64 Correlation Summary
| Measurement | Immigrants from Dominican Republic | Ute |
| Minimum | 65.9% | 25.5% |
| Maximum | 87.8% | 100.0% |
| Range | 21.9% | 74.5% |
| Mean | 76.7% | 66.1% |
| Median | 77.3% | 69.2% |
| Interquartile 25% (IQ1) | 74.9% | 55.7% |
| Interquartile 75% (IQ3) | 79.0% | 74.7% |
| Interquartile Range (IQR) | 4.1% | 19.0% |
| Standard Deviation (Sample) | 3.9% | 15.9% |
| Standard Deviation (Population) | 3.9% | 15.6% |
Similar Demographics by In Labor Force | Age 20-64
Demographics Similar to Immigrants from Dominican Republic by In Labor Force | Age 20-64
In terms of in labor force | age 20-64, the demographic groups most similar to Immigrants from Dominican Republic are Dominican (77.7%, a difference of 0.010%), Cree (77.7%, a difference of 0.010%), Immigrants from Grenada (77.7%, a difference of 0.030%), Immigrants from Central America (77.7%, a difference of 0.070%), and Hispanic or Latino (77.6%, a difference of 0.070%).
| Demographics | Rating | Rank | In Labor Force | Age 20-64 |
| Africans | 0.0 /100 | #289 | Tragic 77.9% |
| Immigrants | Bangladesh | 0.0 /100 | #290 | Tragic 77.9% |
| Spanish Americans | 0.0 /100 | #291 | Tragic 77.8% |
| Immigrants | Azores | 0.0 /100 | #292 | Tragic 77.8% |
| Delaware | 0.0 /100 | #293 | Tragic 77.8% |
| Immigrants | Central America | 0.0 /100 | #294 | Tragic 77.7% |
| Immigrants | Grenada | 0.0 /100 | #295 | Tragic 77.7% |
| Immigrants | Dominican Republic | 0.0 /100 | #296 | Tragic 77.7% |
| Dominicans | 0.0 /100 | #297 | Tragic 77.7% |
| Cree | 0.0 /100 | #298 | Tragic 77.7% |
| Hispanics or Latinos | 0.0 /100 | #299 | Tragic 77.6% |
| Spanish American Indians | 0.0 /100 | #300 | Tragic 77.6% |
| Nepalese | 0.0 /100 | #301 | Tragic 77.5% |
| Iroquois | 0.0 /100 | #302 | Tragic 77.5% |
| Chippewa | 0.0 /100 | #303 | Tragic 77.3% |
Demographics Similar to Ute by In Labor Force | Age 20-64
In terms of in labor force | age 20-64, the demographic groups most similar to Ute are Apache (73.7%, a difference of 0.020%), Native/Alaskan (73.9%, a difference of 0.32%), Crow (73.3%, a difference of 0.51%), Yup'ik (73.2%, a difference of 0.63%), and Puerto Rican (73.1%, a difference of 0.83%).
| Demographics | Rating | Rank | In Labor Force | Age 20-64 |
| Kiowa | 0.0 /100 | #328 | Tragic 75.0% |
| Cheyenne | 0.0 /100 | #329 | Tragic 74.8% |
| Colville | 0.0 /100 | #330 | Tragic 74.8% |
| Paiute | 0.0 /100 | #331 | Tragic 74.7% |
| Arapaho | 0.0 /100 | #332 | Tragic 74.4% |
| Natives/Alaskans | 0.0 /100 | #333 | Tragic 73.9% |
| Apache | 0.0 /100 | #334 | Tragic 73.7% |
| Ute | 0.0 /100 | #335 | Tragic 73.7% |
| Crow | 0.0 /100 | #336 | Tragic 73.3% |
| Yup'ik | 0.0 /100 | #337 | Tragic 73.2% |
| Puerto Ricans | 0.0 /100 | #338 | Tragic 73.1% |
| Houma | 0.0 /100 | #339 | Tragic 72.7% |
| Pueblo | 0.0 /100 | #340 | Tragic 72.6% |
| Immigrants | Yemen | 0.0 /100 | #341 | Tragic 72.3% |
| Yuman | 0.0 /100 | #342 | Tragic 71.7% |