Black/African American vs Immigrants from Congo 6th Grade
COMPARE
Black/African American
Immigrants from Congo
6th Grade
6th Grade Comparison
Blacks/African Americans
Immigrants from Congo
97.0%
6TH GRADE
30.2/ 100
METRIC RATING
189th/ 347
METRIC RANK
96.5%
6TH GRADE
0.6/ 100
METRIC RATING
255th/ 347
METRIC RANK
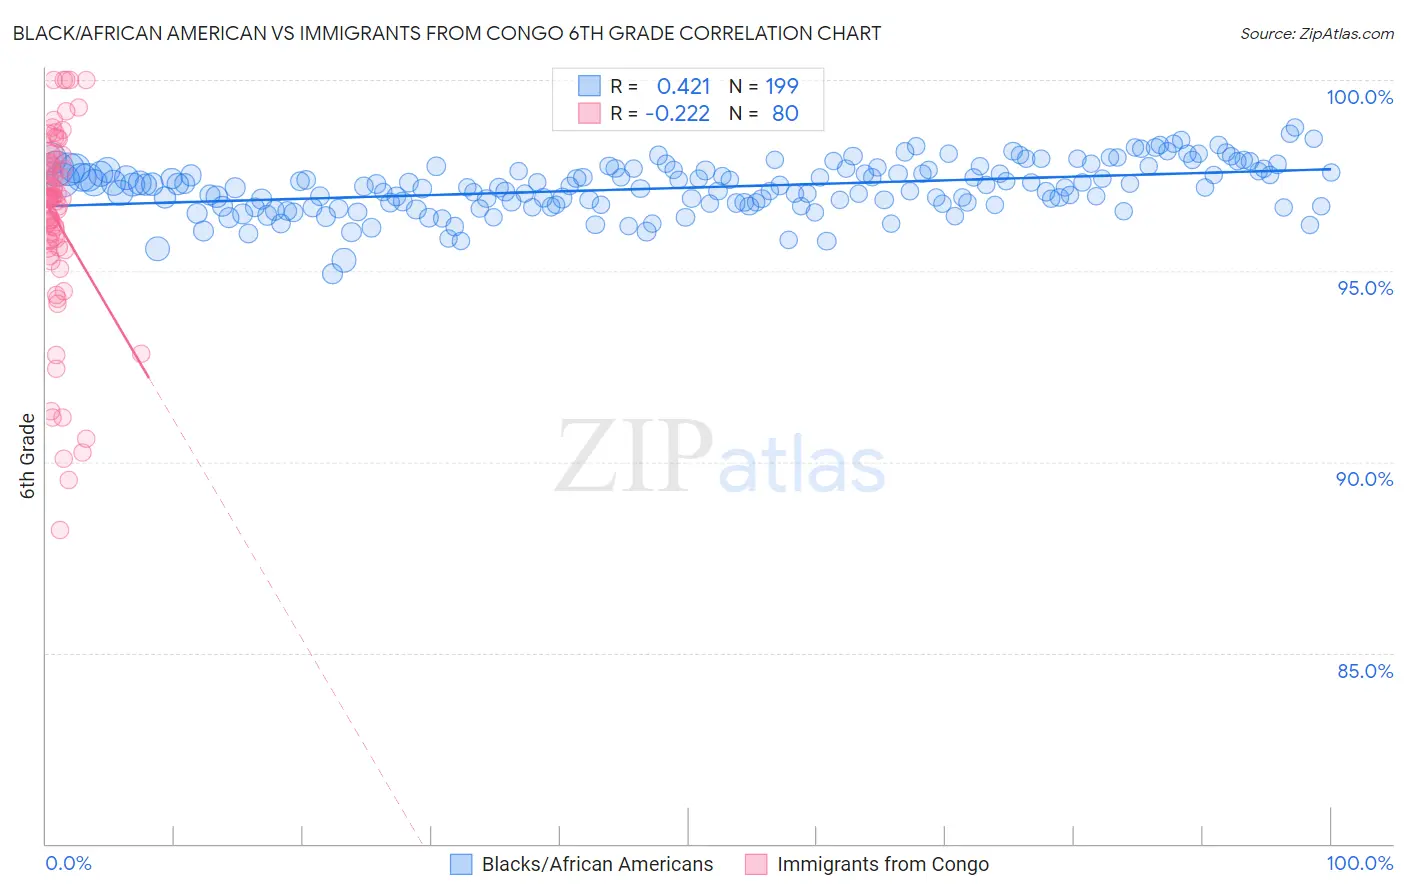
Black/African American vs Immigrants from Congo 6th Grade Correlation Chart
The statistical analysis conducted on geographies consisting of 566,043,668 people shows a moderate positive correlation between the proportion of Blacks/African Americans and percentage of population with at least 6th grade education in the United States with a correlation coefficient (R) of 0.421 and weighted average of 97.0%. Similarly, the statistical analysis conducted on geographies consisting of 92,124,753 people shows a weak negative correlation between the proportion of Immigrants from Congo and percentage of population with at least 6th grade education in the United States with a correlation coefficient (R) of -0.222 and weighted average of 96.5%, a difference of 0.49%.
6th Grade Correlation Summary
| Measurement | Black/African American | Immigrants from Congo |
| Minimum | 94.9% | 88.2% |
| Maximum | 98.7% | 100.0% |
| Range | 3.8% | 11.8% |
| Mean | 97.2% | 96.3% |
| Median | 97.2% | 96.9% |
| Interquartile 25% (IQ1) | 96.7% | 95.6% |
| Interquartile 75% (IQ3) | 97.7% | 97.8% |
| Interquartile Range (IQR) | 0.92% | 2.2% |
| Standard Deviation (Sample) | 0.66% | 2.6% |
| Standard Deviation (Population) | 0.66% | 2.6% |
Similar Demographics by 6th Grade
Demographics Similar to Blacks/African Americans by 6th Grade
In terms of 6th grade, the demographic groups most similar to Blacks/African Americans are Guamanian/Chamorro (97.0%, a difference of 0.0%), Immigrants from Argentina (97.0%, a difference of 0.0%), Argentinean (97.0%, a difference of 0.010%), Immigrants from Egypt (97.0%, a difference of 0.010%), and Dutch West Indian (96.9%, a difference of 0.010%).
| Demographics | Rating | Rank | 6th Grade |
| Immigrants | Ukraine | 35.6 /100 | #182 | Fair 97.0% |
| Immigrants | Venezuela | 34.5 /100 | #183 | Fair 97.0% |
| Spanish Americans | 33.5 /100 | #184 | Fair 97.0% |
| Argentineans | 33.0 /100 | #185 | Fair 97.0% |
| Immigrants | Egypt | 31.4 /100 | #186 | Fair 97.0% |
| Guamanians/Chamorros | 30.6 /100 | #187 | Fair 97.0% |
| Immigrants | Argentina | 30.4 /100 | #188 | Fair 97.0% |
| Blacks/African Americans | 30.2 /100 | #189 | Fair 97.0% |
| Dutch West Indians | 28.3 /100 | #190 | Fair 96.9% |
| Panamanians | 27.3 /100 | #191 | Fair 96.9% |
| Hawaiians | 27.0 /100 | #192 | Fair 96.9% |
| Paraguayans | 26.6 /100 | #193 | Fair 96.9% |
| Immigrants | Lebanon | 25.6 /100 | #194 | Fair 96.9% |
| Immigrants | Brazil | 25.5 /100 | #195 | Fair 96.9% |
| Immigrants | Uganda | 21.2 /100 | #196 | Fair 96.9% |
Demographics Similar to Immigrants from Congo by 6th Grade
In terms of 6th grade, the demographic groups most similar to Immigrants from Congo are Immigrants from Ethiopia (96.5%, a difference of 0.0%), Immigrants from Uruguay (96.5%, a difference of 0.010%), Jamaican (96.5%, a difference of 0.010%), U.S. Virgin Islander (96.5%, a difference of 0.010%), and Immigrants from Senegal (96.5%, a difference of 0.020%).
| Demographics | Rating | Rank | 6th Grade |
| Tohono O'odham | 1.0 /100 | #248 | Tragic 96.5% |
| Colombians | 0.9 /100 | #249 | Tragic 96.5% |
| Immigrants | Middle Africa | 0.8 /100 | #250 | Tragic 96.5% |
| Immigrants | Senegal | 0.7 /100 | #251 | Tragic 96.5% |
| Immigrants | Uruguay | 0.6 /100 | #252 | Tragic 96.5% |
| Jamaicans | 0.6 /100 | #253 | Tragic 96.5% |
| Immigrants | Ethiopia | 0.6 /100 | #254 | Tragic 96.5% |
| Immigrants | Congo | 0.6 /100 | #255 | Tragic 96.5% |
| U.S. Virgin Islanders | 0.5 /100 | #256 | Tragic 96.5% |
| Taiwanese | 0.5 /100 | #257 | Tragic 96.5% |
| Immigrants | China | 0.4 /100 | #258 | Tragic 96.4% |
| South Americans | 0.4 /100 | #259 | Tragic 96.4% |
| Peruvians | 0.4 /100 | #260 | Tragic 96.4% |
| Immigrants | Sierra Leone | 0.4 /100 | #261 | Tragic 96.4% |
| Immigrants | Nigeria | 0.3 /100 | #262 | Tragic 96.4% |