Sri Lankan vs Cherokee In Labor Force | Age 35-44
COMPARE
Sri Lankan
Cherokee
In Labor Force | Age 35-44
In Labor Force | Age 35-44 Comparison
Sri Lankans
Cherokee
84.4%
IN LABOR FORCE | AGE 35-44
47.3/ 100
METRIC RATING
176th/ 347
METRIC RANK
81.4%
IN LABOR FORCE | AGE 35-44
0.0/ 100
METRIC RATING
317th/ 347
METRIC RANK
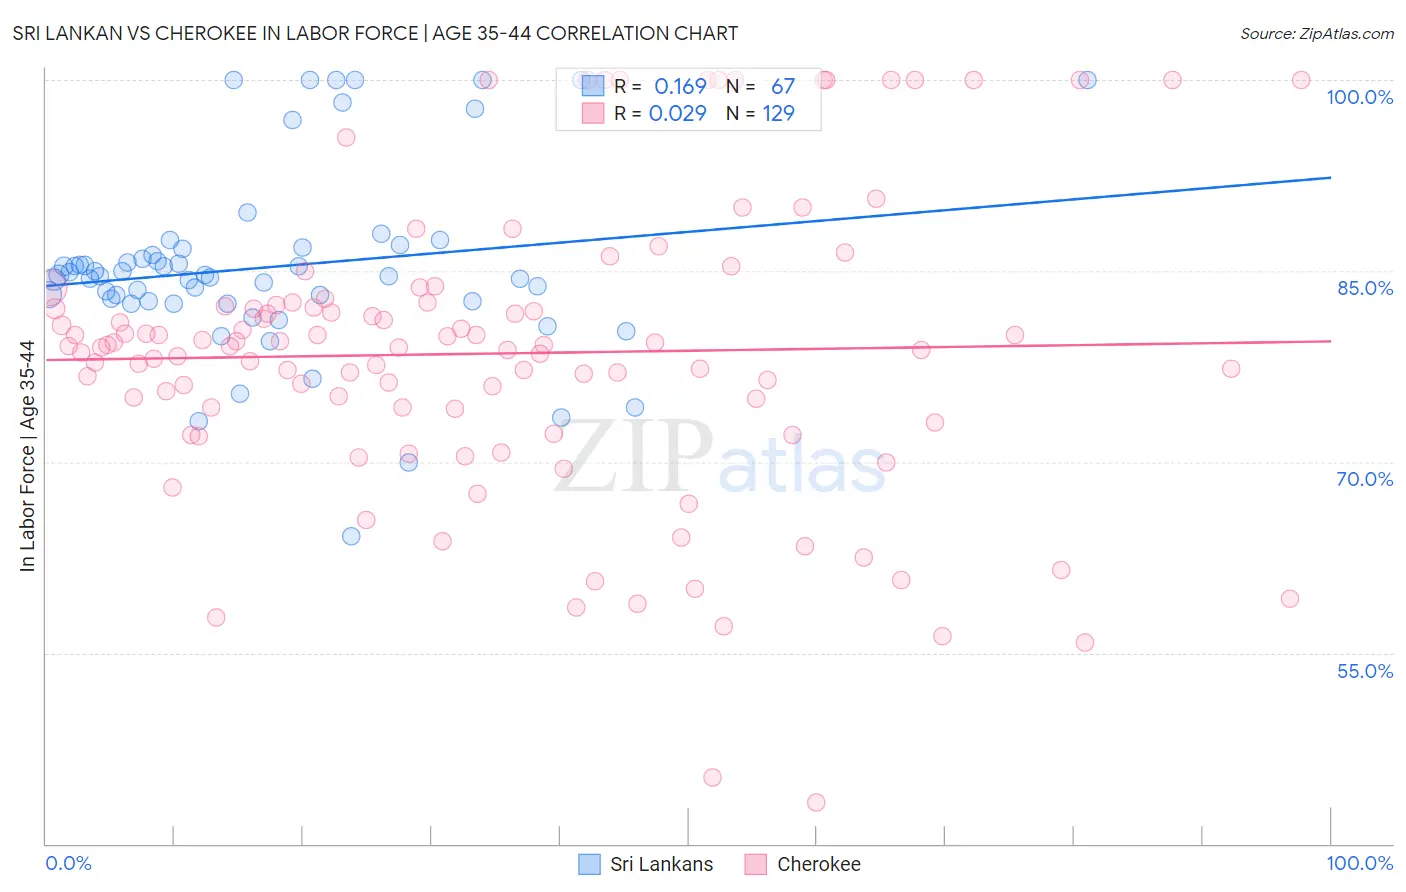
Sri Lankan vs Cherokee In Labor Force | Age 35-44 Correlation Chart
The statistical analysis conducted on geographies consisting of 440,223,389 people shows a poor positive correlation between the proportion of Sri Lankans and labor force participation rate among population between the ages 35 and 44 in the United States with a correlation coefficient (R) of 0.169 and weighted average of 84.4%. Similarly, the statistical analysis conducted on geographies consisting of 493,377,854 people shows no correlation between the proportion of Cherokee and labor force participation rate among population between the ages 35 and 44 in the United States with a correlation coefficient (R) of 0.029 and weighted average of 81.4%, a difference of 3.6%.
In Labor Force | Age 35-44 Correlation Summary
| Measurement | Sri Lankan | Cherokee |
| Minimum | 64.2% | 43.2% |
| Maximum | 100.0% | 100.0% |
| Range | 35.8% | 56.8% |
| Mean | 85.3% | 78.5% |
| Median | 84.6% | 79.1% |
| Interquartile 25% (IQ1) | 82.6% | 73.6% |
| Interquartile 75% (IQ3) | 86.7% | 82.4% |
| Interquartile Range (IQR) | 4.1% | 8.8% |
| Standard Deviation (Sample) | 7.3% | 11.6% |
| Standard Deviation (Population) | 7.2% | 11.6% |
Similar Demographics by In Labor Force | Age 35-44
Demographics Similar to Sri Lankans by In Labor Force | Age 35-44
In terms of in labor force | age 35-44, the demographic groups most similar to Sri Lankans are Pakistani (84.4%, a difference of 0.010%), Immigrants from Trinidad and Tobago (84.4%, a difference of 0.020%), Immigrants from Iran (84.4%, a difference of 0.020%), French Canadian (84.3%, a difference of 0.020%), and Northern European (84.3%, a difference of 0.020%).
| Demographics | Rating | Rank | In Labor Force | Age 35-44 |
| Immigrants | Afghanistan | 52.7 /100 | #169 | Average 84.4% |
| Immigrants | Jordan | 52.5 /100 | #170 | Average 84.4% |
| Jordanians | 51.7 /100 | #171 | Average 84.4% |
| Scandinavians | 51.2 /100 | #172 | Average 84.4% |
| Immigrants | Trinidad and Tobago | 50.7 /100 | #173 | Average 84.4% |
| Immigrants | Iran | 50.0 /100 | #174 | Average 84.4% |
| Pakistanis | 48.2 /100 | #175 | Average 84.4% |
| Sri Lankans | 47.3 /100 | #176 | Average 84.4% |
| French Canadians | 44.3 /100 | #177 | Average 84.3% |
| Northern Europeans | 44.1 /100 | #178 | Average 84.3% |
| Immigrants | South Africa | 42.8 /100 | #179 | Average 84.3% |
| Danes | 38.8 /100 | #180 | Fair 84.3% |
| Immigrants | West Indies | 36.4 /100 | #181 | Fair 84.3% |
| Koreans | 36.3 /100 | #182 | Fair 84.3% |
| Barbadians | 36.2 /100 | #183 | Fair 84.3% |
Demographics Similar to Cherokee by In Labor Force | Age 35-44
In terms of in labor force | age 35-44, the demographic groups most similar to Cherokee are Comanche (81.5%, a difference of 0.080%), Immigrants from Mexico (81.5%, a difference of 0.10%), Alaskan Athabascan (81.3%, a difference of 0.12%), Cajun (81.5%, a difference of 0.13%), and Alaska Native (81.6%, a difference of 0.24%).
| Demographics | Rating | Rank | In Labor Force | Age 35-44 |
| Blackfeet | 0.0 /100 | #310 | Tragic 81.9% |
| Colville | 0.0 /100 | #311 | Tragic 81.7% |
| Alaska Natives | 0.0 /100 | #312 | Tragic 81.6% |
| Mexicans | 0.0 /100 | #313 | Tragic 81.6% |
| Cajuns | 0.0 /100 | #314 | Tragic 81.5% |
| Immigrants | Mexico | 0.0 /100 | #315 | Tragic 81.5% |
| Comanche | 0.0 /100 | #316 | Tragic 81.5% |
| Cherokee | 0.0 /100 | #317 | Tragic 81.4% |
| Alaskan Athabascans | 0.0 /100 | #318 | Tragic 81.3% |
| Inupiat | 0.0 /100 | #319 | Tragic 80.9% |
| Chickasaw | 0.0 /100 | #320 | Tragic 80.9% |
| Puerto Ricans | 0.0 /100 | #321 | Tragic 80.7% |
| Paiute | 0.0 /100 | #322 | Tragic 80.6% |
| Yaqui | 0.0 /100 | #323 | Tragic 80.5% |
| Choctaw | 0.0 /100 | #324 | Tragic 80.5% |