Blackfeet vs Nicaraguan Householder Income Over 65 years
COMPARE
Blackfeet
Nicaraguan
Householder Income Over 65 years
Householder Income Over 65 years Comparison
Blackfeet
Nicaraguans
$54,029
HOUSEHOLDER INCOME OVER 65 YEARS
0.1/ 100
METRIC RATING
279th/ 347
METRIC RANK
$54,474
HOUSEHOLDER INCOME OVER 65 YEARS
0.1/ 100
METRIC RATING
269th/ 347
METRIC RANK
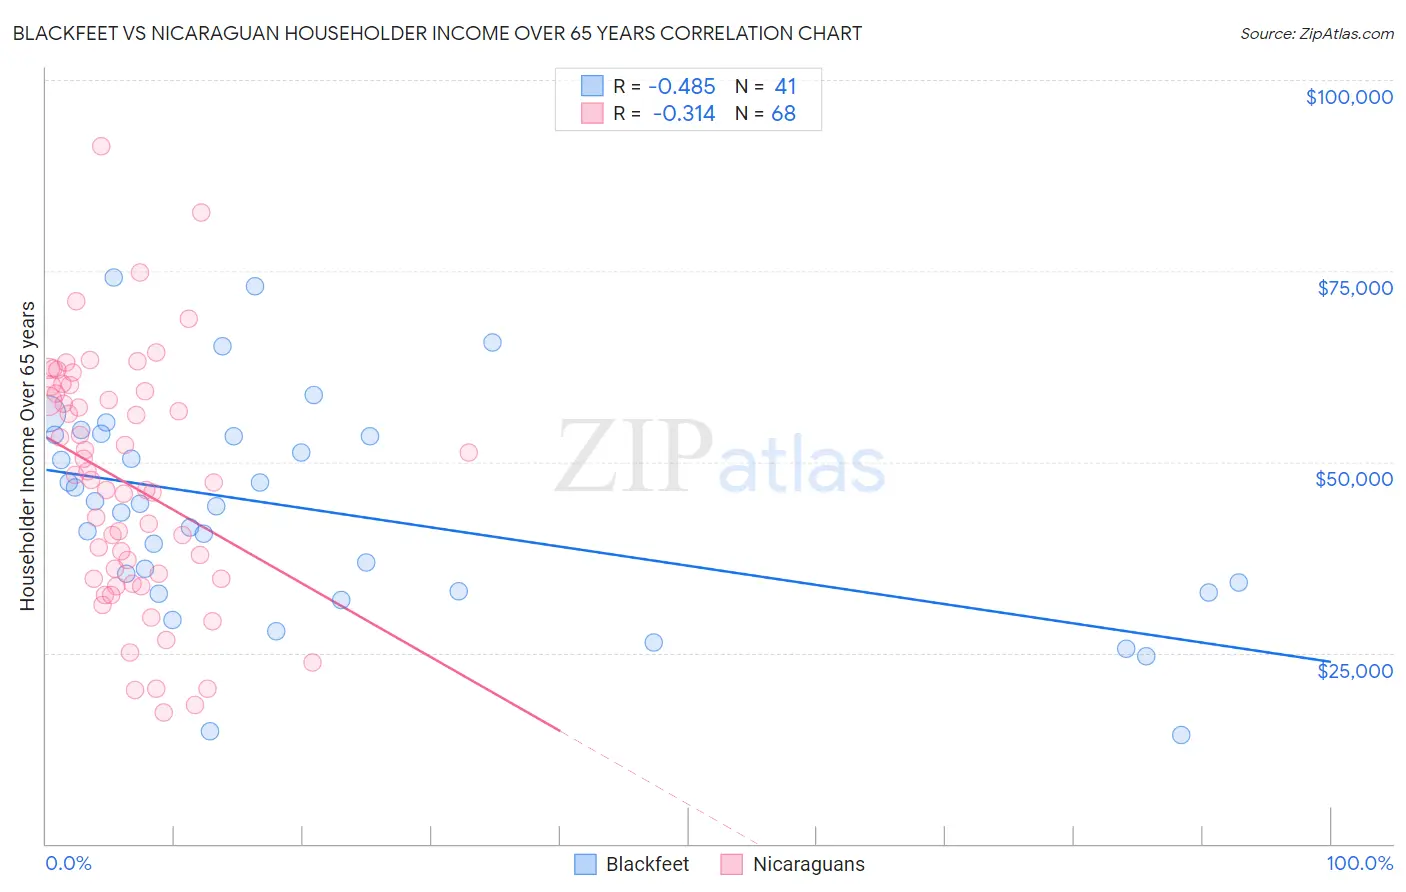
Blackfeet vs Nicaraguan Householder Income Over 65 years Correlation Chart
The statistical analysis conducted on geographies consisting of 308,657,896 people shows a moderate negative correlation between the proportion of Blackfeet and household income with householder over the age of 65 in the United States with a correlation coefficient (R) of -0.485 and weighted average of $54,029. Similarly, the statistical analysis conducted on geographies consisting of 284,992,012 people shows a mild negative correlation between the proportion of Nicaraguans and household income with householder over the age of 65 in the United States with a correlation coefficient (R) of -0.314 and weighted average of $54,474, a difference of 0.82%.
Householder Income Over 65 years Correlation Summary
| Measurement | Blackfeet | Nicaraguan |
| Minimum | $14,196 | $17,217 |
| Maximum | $74,087 | $91,300 |
| Range | $59,891 | $74,083 |
| Mean | $43,504 | $47,136 |
| Median | $44,167 | $47,473 |
| Interquartile 25% (IQ1) | $32,958 | $34,685 |
| Interquartile 75% (IQ3) | $53,466 | $59,068 |
| Interquartile Range (IQR) | $20,508 | $24,383 |
| Standard Deviation (Sample) | $14,024 | $15,884 |
| Standard Deviation (Population) | $13,852 | $15,767 |
Demographics Similar to Blackfeet and Nicaraguans by Householder Income Over 65 years
In terms of householder income over 65 years, the demographic groups most similar to Blackfeet are Immigrants from Ecuador ($54,030, a difference of 0.0%), Immigrants from Jamaica ($54,027, a difference of 0.0%), Somali ($54,004, a difference of 0.050%), Immigrants from Armenia ($53,974, a difference of 0.10%), and Cheyenne ($54,096, a difference of 0.12%). Similarly, the demographic groups most similar to Nicaraguans are Immigrants from Senegal ($54,447, a difference of 0.050%), Immigrants from Zaire ($54,512, a difference of 0.070%), Guatemalan ($54,526, a difference of 0.10%), Jamaican ($54,560, a difference of 0.16%), and Belizean ($54,580, a difference of 0.20%).
| Demographics | Rating | Rank | Householder Income Over 65 years |
| Apache | 0.1 /100 | #264 | Tragic $54,668 |
| Belizeans | 0.1 /100 | #265 | Tragic $54,580 |
| Jamaicans | 0.1 /100 | #266 | Tragic $54,560 |
| Guatemalans | 0.1 /100 | #267 | Tragic $54,526 |
| Immigrants | Zaire | 0.1 /100 | #268 | Tragic $54,512 |
| Nicaraguans | 0.1 /100 | #269 | Tragic $54,474 |
| Immigrants | Senegal | 0.1 /100 | #270 | Tragic $54,447 |
| Liberians | 0.1 /100 | #271 | Tragic $54,356 |
| Potawatomi | 0.1 /100 | #272 | Tragic $54,212 |
| Indonesians | 0.1 /100 | #273 | Tragic $54,176 |
| Barbadians | 0.1 /100 | #274 | Tragic $54,163 |
| Cherokee | 0.1 /100 | #275 | Tragic $54,133 |
| Cree | 0.1 /100 | #276 | Tragic $54,129 |
| Cheyenne | 0.1 /100 | #277 | Tragic $54,096 |
| Immigrants | Ecuador | 0.1 /100 | #278 | Tragic $54,030 |
| Blackfeet | 0.1 /100 | #279 | Tragic $54,029 |
| Immigrants | Jamaica | 0.1 /100 | #280 | Tragic $54,027 |
| Somalis | 0.1 /100 | #281 | Tragic $54,004 |
| Immigrants | Armenia | 0.1 /100 | #282 | Tragic $53,974 |
| Immigrants | Liberia | 0.1 /100 | #283 | Tragic $53,967 |
| Immigrants | Guatemala | 0.1 /100 | #284 | Tragic $53,950 |