Immigrants from Honduras vs Cypriot In Labor Force | Age 25-29
COMPARE
Immigrants from Honduras
Cypriot
In Labor Force | Age 25-29
In Labor Force | Age 25-29 Comparison
Immigrants from Honduras
Cypriots
83.3%
IN LABOR FORCE | AGE 25-29
0.0/ 100
METRIC RATING
276th/ 347
METRIC RANK
85.8%
IN LABOR FORCE | AGE 25-29
99.9/ 100
METRIC RATING
35th/ 347
METRIC RANK
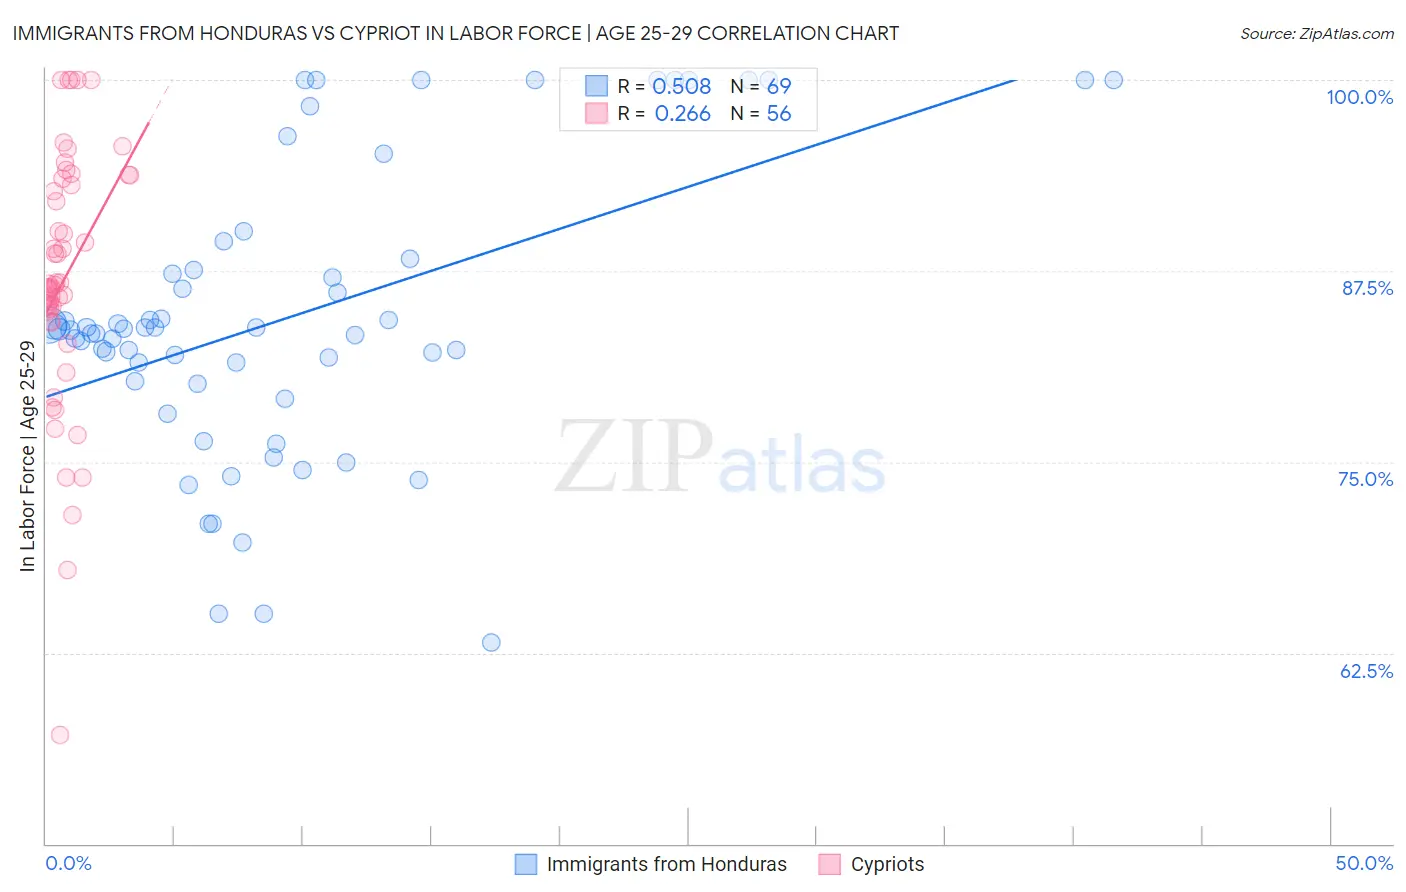
Immigrants from Honduras vs Cypriot In Labor Force | Age 25-29 Correlation Chart
The statistical analysis conducted on geographies consisting of 322,539,731 people shows a substantial positive correlation between the proportion of Immigrants from Honduras and labor force participation rate among population between the ages 25 and 29 in the United States with a correlation coefficient (R) of 0.508 and weighted average of 83.3%. Similarly, the statistical analysis conducted on geographies consisting of 61,853,224 people shows a weak positive correlation between the proportion of Cypriots and labor force participation rate among population between the ages 25 and 29 in the United States with a correlation coefficient (R) of 0.266 and weighted average of 85.8%, a difference of 3.0%.
In Labor Force | Age 25-29 Correlation Summary
| Measurement | Immigrants from Honduras | Cypriot |
| Minimum | 63.2% | 57.1% |
| Maximum | 100.0% | 100.0% |
| Range | 36.8% | 42.9% |
| Mean | 84.4% | 86.9% |
| Median | 83.7% | 86.5% |
| Interquartile 25% (IQ1) | 80.2% | 84.6% |
| Interquartile 75% (IQ3) | 87.9% | 93.3% |
| Interquartile Range (IQR) | 7.7% | 8.7% |
| Standard Deviation (Sample) | 9.3% | 8.4% |
| Standard Deviation (Population) | 9.3% | 8.3% |
Similar Demographics by In Labor Force | Age 25-29
Demographics Similar to Immigrants from Honduras by In Labor Force | Age 25-29
In terms of in labor force | age 25-29, the demographic groups most similar to Immigrants from Honduras are Samoan (83.3%, a difference of 0.0%), Marshallese (83.3%, a difference of 0.050%), Immigrants from Dominica (83.4%, a difference of 0.070%), African (83.2%, a difference of 0.070%), and Immigrants from Caribbean (83.4%, a difference of 0.080%).
| Demographics | Rating | Rank | In Labor Force | Age 25-29 |
| Immigrants | Barbados | 0.0 /100 | #269 | Tragic 83.4% |
| Basques | 0.0 /100 | #270 | Tragic 83.4% |
| Hondurans | 0.0 /100 | #271 | Tragic 83.4% |
| Immigrants | Caribbean | 0.0 /100 | #272 | Tragic 83.4% |
| Immigrants | Dominica | 0.0 /100 | #273 | Tragic 83.4% |
| Marshallese | 0.0 /100 | #274 | Tragic 83.3% |
| Samoans | 0.0 /100 | #275 | Tragic 83.3% |
| Immigrants | Honduras | 0.0 /100 | #276 | Tragic 83.3% |
| Africans | 0.0 /100 | #277 | Tragic 83.2% |
| Immigrants | Cuba | 0.0 /100 | #278 | Tragic 83.2% |
| British West Indians | 0.0 /100 | #279 | Tragic 83.2% |
| Dominicans | 0.0 /100 | #280 | Tragic 83.2% |
| Immigrants | Dominican Republic | 0.0 /100 | #281 | Tragic 83.1% |
| Americans | 0.0 /100 | #282 | Tragic 83.1% |
| Immigrants | Azores | 0.0 /100 | #283 | Tragic 83.1% |
Demographics Similar to Cypriots by In Labor Force | Age 25-29
In terms of in labor force | age 25-29, the demographic groups most similar to Cypriots are Immigrants from Nepal (85.8%, a difference of 0.0%), Lithuanian (85.8%, a difference of 0.010%), Polish (85.8%, a difference of 0.030%), German Russian (85.8%, a difference of 0.040%), and Slovak (85.8%, a difference of 0.040%).
| Demographics | Rating | Rank | In Labor Force | Age 25-29 |
| Ugandans | 100.0 /100 | #28 | Exceptional 85.9% |
| Immigrants | Liberia | 100.0 /100 | #29 | Exceptional 85.9% |
| Immigrants | Serbia | 100.0 /100 | #30 | Exceptional 85.9% |
| German Russians | 100.0 /100 | #31 | Exceptional 85.8% |
| Slovaks | 100.0 /100 | #32 | Exceptional 85.8% |
| Immigrants | Bulgaria | 100.0 /100 | #33 | Exceptional 85.8% |
| Lithuanians | 99.9 /100 | #34 | Exceptional 85.8% |
| Cypriots | 99.9 /100 | #35 | Exceptional 85.8% |
| Immigrants | Nepal | 99.9 /100 | #36 | Exceptional 85.8% |
| Poles | 99.9 /100 | #37 | Exceptional 85.8% |
| Sierra Leoneans | 99.9 /100 | #38 | Exceptional 85.8% |
| Croatians | 99.9 /100 | #39 | Exceptional 85.8% |
| Immigrants | Albania | 99.9 /100 | #40 | Exceptional 85.7% |
| Immigrants | Greece | 99.9 /100 | #41 | Exceptional 85.7% |
| Immigrants | Eritrea | 99.9 /100 | #42 | Exceptional 85.7% |